Evan Burger continues his series on redistricting with analysis of the newly released proposed congressional map.
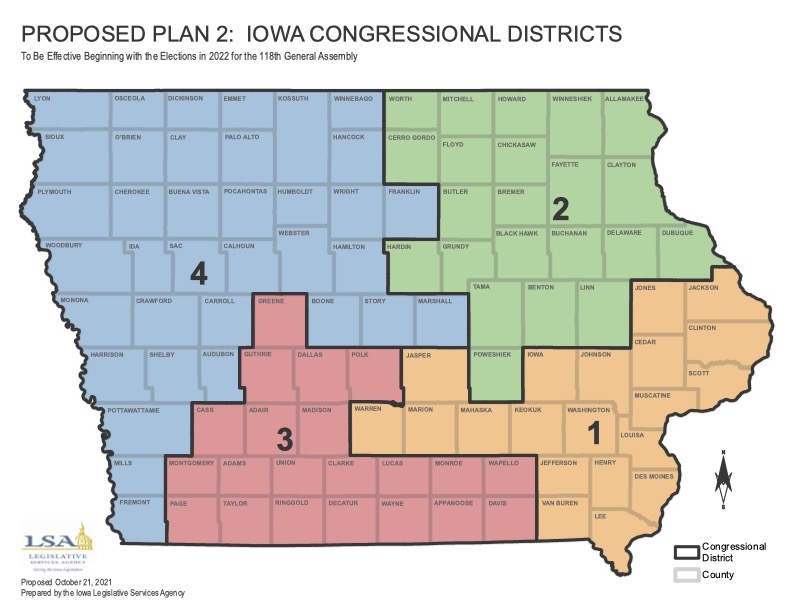
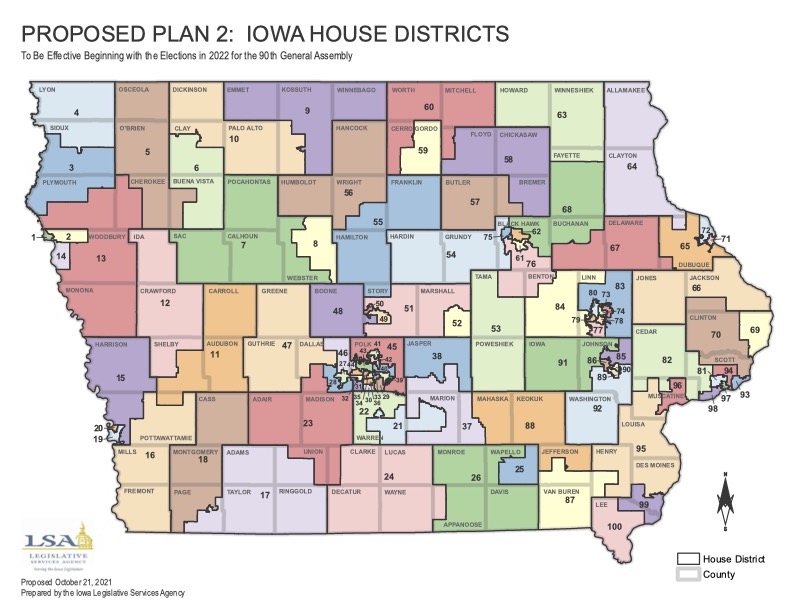
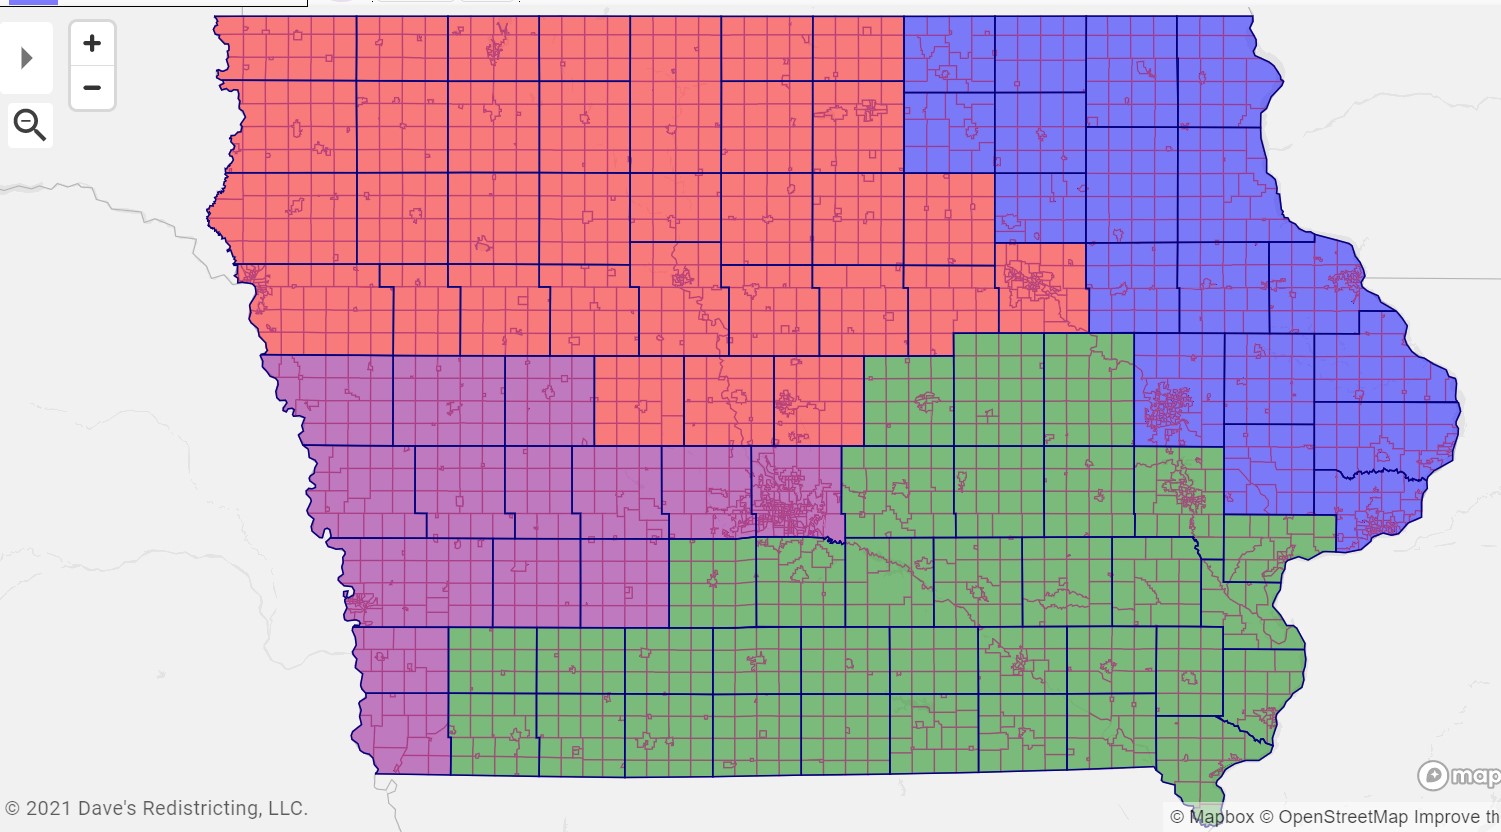
This morning, the Legislative Services Agency released their first set of proposed maps, which can be found here. As expected, the LSA released both congressional and legislative maps — for today I’ll focus on the former, with more analysis to come on the legislative front.
By the numbers
As I’ve written here before, the three standards that the LSA considers in producing a map are contiguity, population equality, and compactness. Of the three, contiguity is an absolute standard: a congressional district must be made up of whole counties that are contiguous. The next most important standard is population equality, meaning the LSA tries to make districts as close in population as possible. However, they must also consider the compactness of a given map, both in terms of minimizing the difference between the length and width of each district, and in terms of minimizing the total perimeter length of all districts.
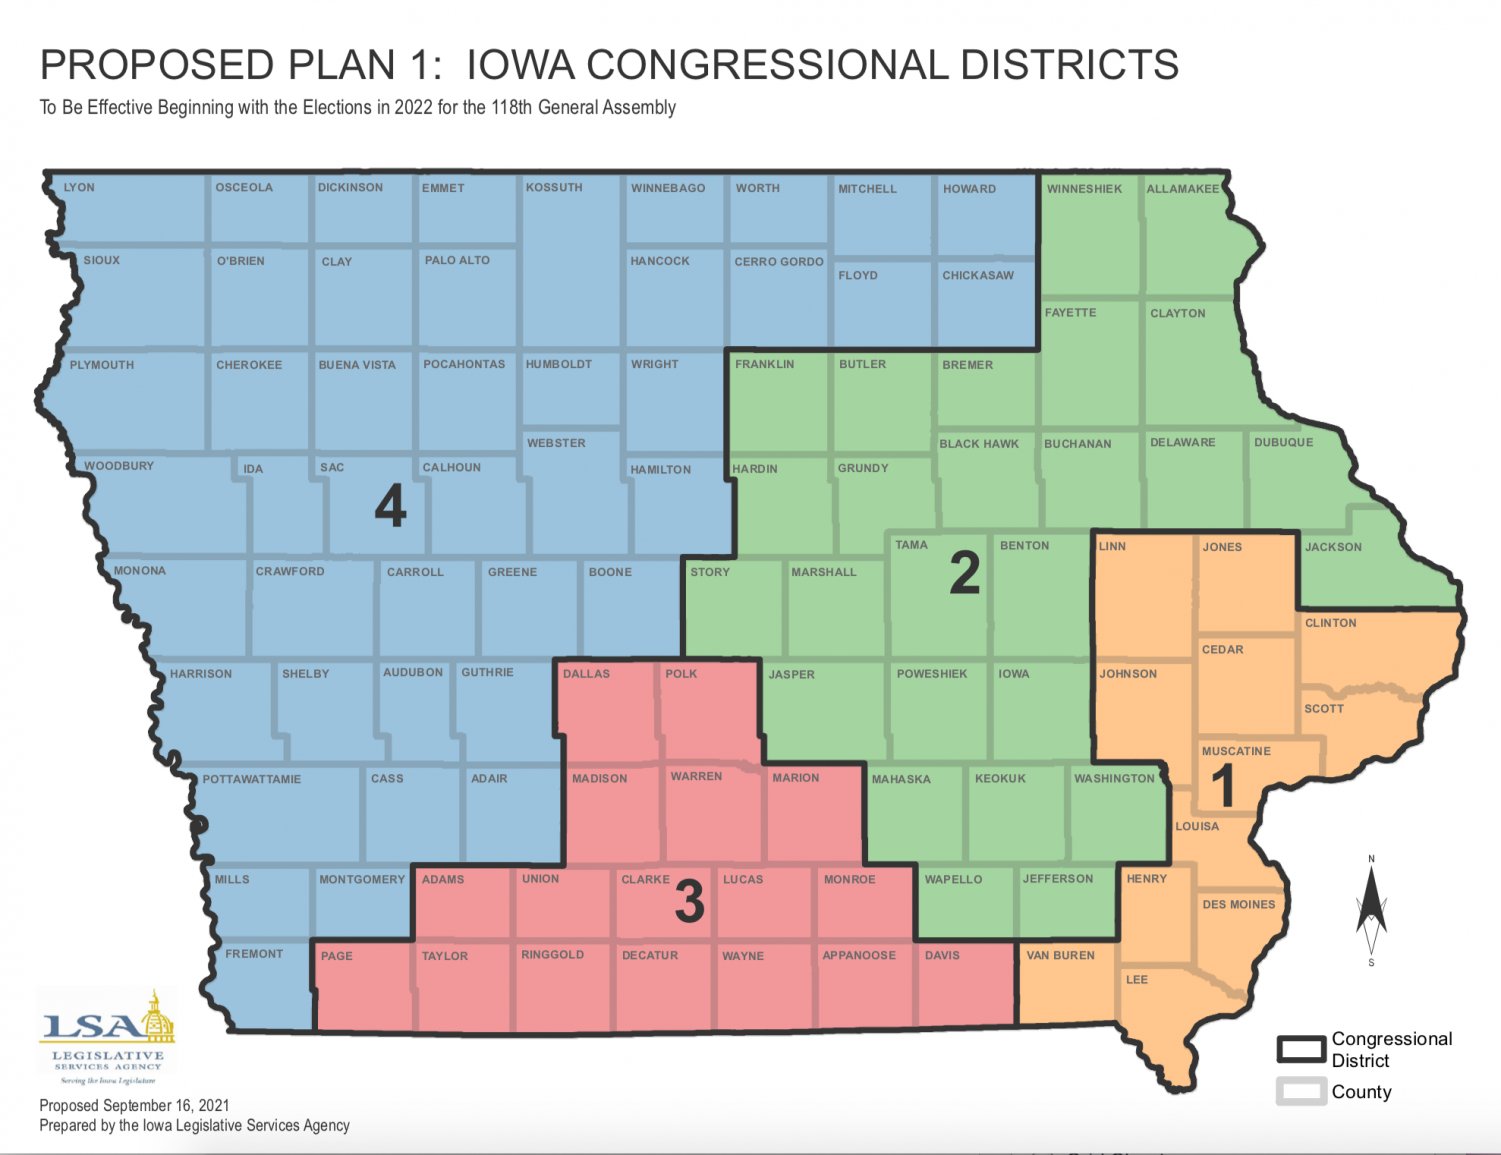
The LSA’s proposed congressional map easily meets the contiguity requirement. Here is how it scores on population equality and the two measures of compactness:
- Lowest Population: District 2 (797,556)
- Highest Population: District 1 (797,655)
- Difference between lowest and highest population: 99
- Total Perimeter Score: 2,772.02 miles
- Average Length-Width Compactness: 34.96 miles
Continue Reading...