Iowa is at more risk of swinging to Donald Trump than any other state President Barack Obama carried twice. Demographics go a long way toward explaining why.
Compared to most battleground states, Iowa has a less diverse population. About 86.7 percent of residents are non-Hispanic whites, according to the latest census data. Roughly a quarter of Iowans at least 25 years old have a bachelor’s degree or higher level of education. Polls have indicated race and education levels are strongly correlated with support for Trump or Hillary Clinton, with non-college-educated whites among the strongest voting blocs for the Republican.
On the flip side, numerous polls have found very low levels of support for Trump among Latino, African-American, and Asian-American voters.
Traditionally, Americans in those groups have voted at lower rates than have non-Hispanic whites. But it would be a mistake to discount their impact, even in this overwhelmingly white state. Al Gore won Iowa by just 4,144 votes out of more than 1.3 million cast in 2000. Four years later, George W. Bush defeated John Kerry by just 10,059 votes out of more than 1.5 million cast.
A strong GOTV campaign aimed at minority voters who support Clinton (or at least despise Trump) could mobilize enough Iowans to change the statewide outcome.
Follow me after the jump to see where organizers and volunteers for the Iowa Democratic “coordinated campaign” will likely concentrate those efforts.
Caveat: Counting Iowa voters or potential voters by race is not a straightforward task.
The Iowa Secretary of State’s office does not record the race or ethnicity of registered voters. The most recent data available on the the U.S. Census Bureau’s website do not indicate whether members of various ethnic groups are eligible voters or unable to vote because they are not of legal age, are not citizens, or have lost their voting rights. Iowa has one of the country’s harshest bans on voting by citizens convicted of felonies. That policy disproportionately affects African-Americans and to a lesser extent Latinos.
The enclosed estimates draw on the best available resources.
LATINOS IN IOWA
The latest data from the U.S. Census Bureau show that as of July 2015, 86.7 percent of Iowa’s 3,123,899 residents were “white, not Hispanic or Latino.” The second-largest racial or ethnic group were the 5.7 of Iowans (roughly 178,000 people) categorized as “Hispanic or Latino.” The Latino population in Iowa has more than doubled since 2000.
Tens of thousands of Iowa Latinos are not U.S. citizens, and many others are not old enough to vote. The Latinos in Iowa 2015 report by the Iowa Data Center noted that 52,949 Latinos were “enrolled in the state’s elementary and high schools during the 2014-2015 school year,” and that 12.1 percent of Iowa Latinos were under age 5 as of July 1, 2014. In fact, “Latinos have a higher concentration of preschoolers among the population than any other race or ethnic group” in our state.
The League of United Latin American Citizens (LULAC) has been compiling data on Latino voters in Iowa for nearly a decade. According to Joe Henry, LULAC’s state leader and national vice president, his organization identified approximately 23,000 registered Latino voters in Iowa during the 2008 election cycle. That number had grown to 35,000 by 2012. Before this year’s Iowa caucuses, LULAC estimated that 50,000 Latinos were registered to vote here, out of some 73,000 believed to be eligible to vote.
Henry told me Latino registered voters are “a very young demographic” in Iowa: about 56 percent of are under age 40, most of those millennials. A plurality are affiliated with neither party, and more are registered Democrats than Republicans. LULAC has 15 councils in Iowa that will work to mobilize voters this fall. Christian Ucles, who was LULAC’s political director before this year’s Iowa caucuses, recently started working as the Iowa Democratic Party’s Latino outreach coordinator.
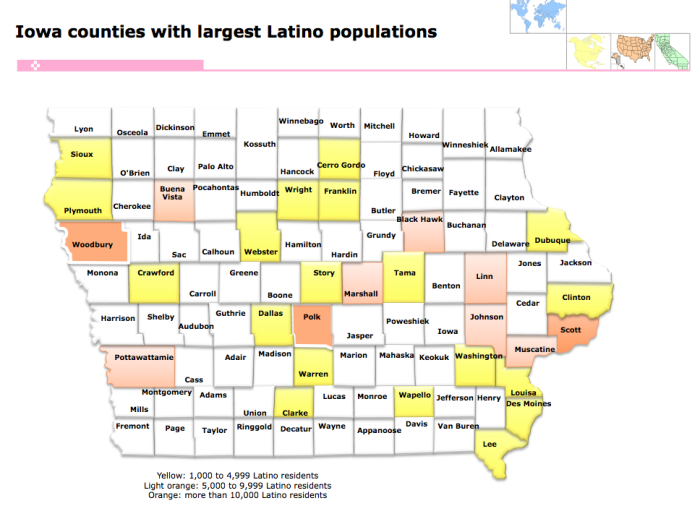
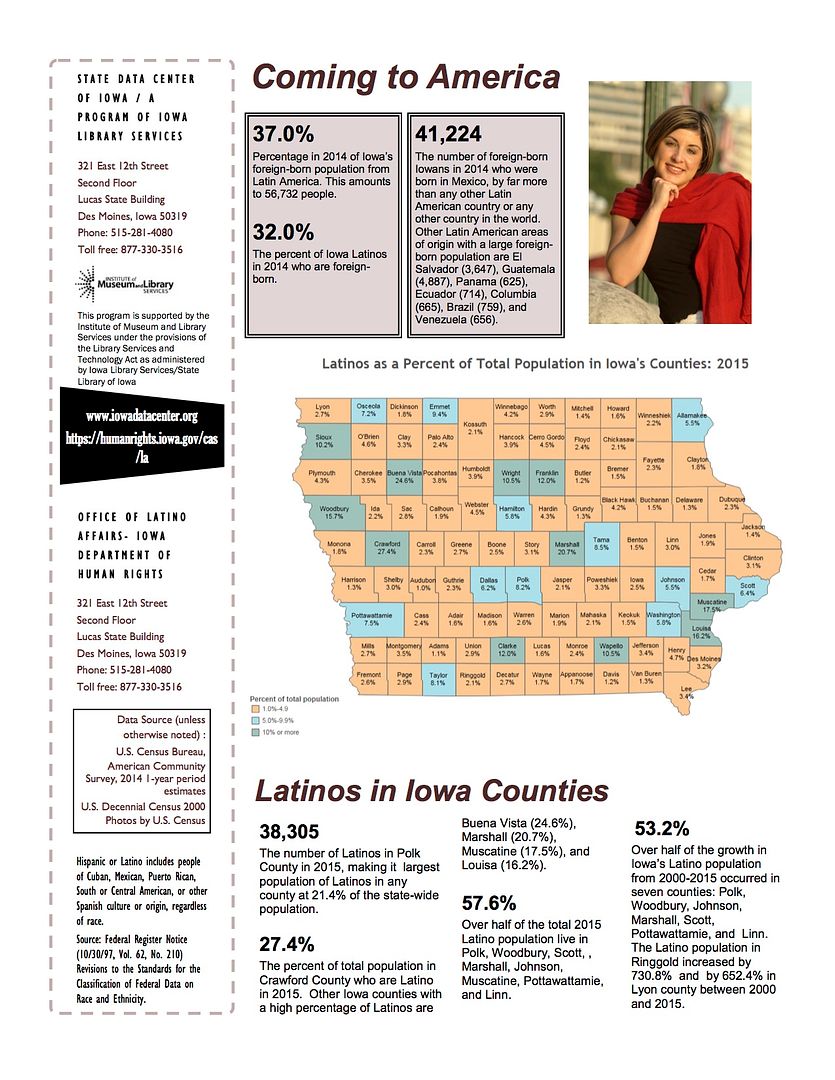
A number of Iowa’s rural counties have significant Latino populations, because the meatpacking industry and some other parts of the agricultural sector have drawn heavily on immigrant labor. That said, most Latinos live in counties with larger metro areas. These graphics come from the Latinos in Iowa 2015 report UPDATE: Replaced this image with a page from the Latinos in Iowa 2016 report, which the state released on September 22. According to that report, Woods & Pool Economics Inc. have projected that the Latino population will grow to 441,049 (12.9 percent of Iowans) by 2050.
Using the Iowa Data Center’s information and the Census Bureau’s website to find population estimates by county as of July 2015, I compiled a list of Iowa counties where at least 1,000 Latinos live. Note that these numbers do not represent eligible or registered voters. However, it’s reasonable to infer that counties with the most Latino residents will also have the most eligible Latino voters.
Note also that some counties where the proportion of Latino residents exceeds the statewide average (such as Emmet County) are not listed, because in absolute terms the Latino population there is still relatively small.
| Iowa counties with the most Latino residents | |||
| County | Estimated total population (July 2015) | Hispanic or Latino percentage | Estimated Latino population (July 2015) |
|---|---|---|---|
| Polk | 467,711 | 8.2 percent | 38,352 |
| Woodbury | 102,782 | 15.7 percent | 16,136 |
| Scott | 172,126 | 6.4 percent | 11,016 |
| Marshall | 40,746 | 20.7 percent | 8,434 |
| Johnson | 144,251 | 5.5 percent | 7,933 |
| Muscatine | 43,011 | 17.5 percent | 7,526 |
| Pottawattamie | 93,671 | 7.5 percent | 7,025 |
| Linn | 219,916 | 3.0 percent | 6,597 |
| Black Hawk | 133,455 | 4.2 percent | 5,605 |
| Buena Vista | 20,493 | 24.6 percent | 5,041 |
| Dallas | 80,133 | 6.2 percent | 4,968 |
| Crawford | 17,094 | 27.4 percent | 4,683 |
| Wapello | 35,173 | 10.5 percent | 3,693 |
| Sioux | 34,937 | 10.2 percent | 3,569 |
| Story | 96,021 | 3.1 percent | 2,976 |
| Dubuque | 97,125 | 2.3 percent | 2,233 |
| Cerro Gordo | 43,017 | 4.5 percent | 1,935 |
| Louisa | 11,185 | 16.2 percent | 1,811 |
| Webster | 37,071 | 4.5 percent | 1,668 |
| Clinton | 47,768 | 3.1 percent | 1,487 |
| Tama | 17,337 | 8.5 percent | 1,474 |
| Wright | 12,773 | 10.5 percent | 1,341 |
| Washington | 22,247 | 5.8 percent | 1,290 |
| Des Moines | 40,055 | 3.2 percent | 1,282 |
| Warren | 48,626 | 2.6 percent | 1,264 |
| Franklin | 10,295 | 12.0 percent | 1,235 |
| Lee | 35,089 | 3.4 percent | 1,193 |
| Clarke | 9,259 | 12.0 percent | 1,111 |
| Plymouth | 24,800 | 4.3 percent | 1,066 |
By my calculations, 29 of Iowa’s 99 counties have at least 1,000 Latino residents. I’ve represented those on this map:
Iowa polls on the presidential race typically have very few Latino respondents, so I have not seen any data on preferences for Clinton or Trump. Several national polls have found Trump is “on track for an historically low performance among Latino voters.” In some states, a “Trump effect” is driving more Latinos to become U.S. citizens and register to vote.
Since more than three-quarters of Iowa Latinos either were born in Mexico or have ancestors who came from that country, I doubt many of them will vote for a man who shot to the top of Republican polls soon after falsely claiming Mexico was sending “rapists” and other criminals to live in the United States.
AFRICAN-AMERICANS IN IOWA
The latest census data indicate that about 109,000 Iowans are African-American, representing about 3.5 percent of the state population. Compared to Latinos, black Iowans are more likely to live in a handful of large metro areas. According to the African-Americans in Iowa 2016 report by the State Data Center and the Iowa Commission on the Status of African-Americans, more than 57 percent of black people in the state live in the cities of Des Moines, Davenport, Waterloo, or Cedar Rapids. Nearly 70 percent live in one of five counties: Polk, Scott, Black Hawk, Linn, or Johnson.
I have been unable to find reliable estimates for the number of African-American registered Iowa voters. Neither the Secretary of State’s Office nor the Iowa Department of Human Rights compiles that information.
Whereas a significant proportion of Iowa Latinos are ineligible to vote because they are not citizens, the overwhelming majority of African-Americans in Iowa were born in this country–though thousands of immigrants from Africa have settled here, especially in the Des Moines area.
The biggest obstacle to voting for African-Americans in Iowa stems from racial disparities in our state’s criminal justice system, which have long been among the worst in the country. African-Americans represent about 25.5 percent of the state’s incarcerated population and about the same proportion of Iowans who have lost their voting rights because of felony convictions.
The Sentencing Project estimated in 2010 that 4,473 of the 21,888 Iowans unable to vote because of a felony conviction were African-Americans. The number of Iowans disenfranchised for that reason has skyrocketed to an estimated 57,000 since Governor Terry Branstad issued an executive order on felon voting in January 2011. Shortly after the last presidential election, NAACP leaders tried unsuccessfully to persuade Branstad to change Iowa’s unusually broad ban on felon voting because of its well-documented impact on African-Americans.
Exit polls didn’t estimate how many minority voters in Iowa cast ballots in the 2012 general election, because they represented such a small fraction of the state’s population. However, national data indicated that “black voters turned out at higher rates than white voters for the first time since such comparisons began to be made in 1996.”
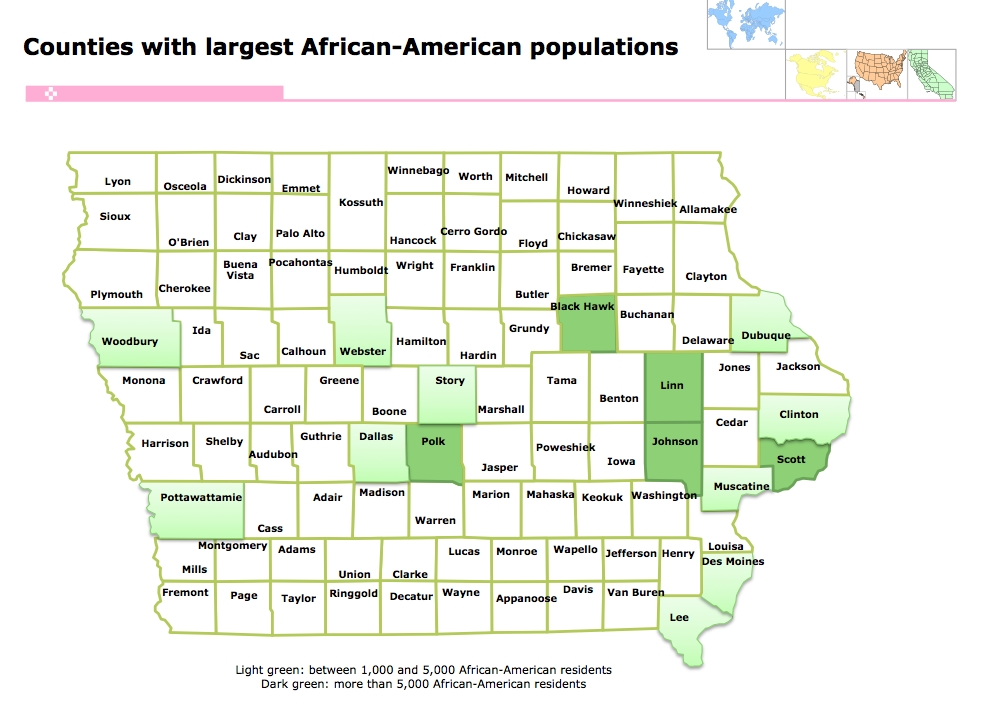
Despite barriers to participation that affect more black Iowans than whites, African-American voters represent a large enough group to change the outcome of a close presidential race here. Using Census Bureau population estimates by county as of July 2015, I compiled a list of Iowa counties where at least 1,000 African-Americans live. Note that these numbers do not represent eligible or registered voters. But as mentioned above, it’s reasonable to infer that counties where the most black people live will also have the most eligible voters.
| Iowa counties with the most African-American residents | |||
| County | Estimated total population (July 2015) | African-American percentage | Estimated African-American population (July 2015) |
|---|---|---|---|
| Polk | 467,711 | 6.7 percent | 31,336 |
| Scott | 172,126 | 7.6 percent | 13,081 |
| Black Hawk | 133,455 | 9.0 percent | 12,010 |
| Linn | 219,916 | 4.7 percent | 10,336 |
| Johnson | 144,251 | 6.1 percent | 8,799 |
| Dubuque | 97,125 | 3.2 percent | 3,108 |
| Woodbury | 102,782 | 3.0 percent | 3,083 |
| Story | 96,021 | 2.9 percent | 2,784 |
| Des Moines | 40,055 | 6.1 percent | 2,443 |
| Webster | 37,071 | 4.5 percent | 1,668 |
| Pottawattamie | 93,671 | 1.7 percent | 1,592 |
| Clinton | 47,768 | 3.3 percent | 1,576 |
| Dallas | 80,133 | 1.8 percent | 1,442 |
| Lee | 35,089 | 3.1 percent | 1,087 |
| Muscatine | 43,011 | 2.4 percent | 1,032 |
By my calculations, fifteen Iowa counties have at least 1,000 African-American residents.
I am not aware of any surveys measuring support for Clinton or Trump among African-Americans in Iowa, but some national polls and surveys taken in states with larger black populations suggest that Clinton will receive more than 90 percent of African-American votes.
ASIAN-AMERICANS IN IOWA
In recent years, Asian-Americans have been the fastest-growing racial or ethnic group in the country and in Iowa. However, Iowa still has far fewer Asian-American residents than African-Americans or Latinos.
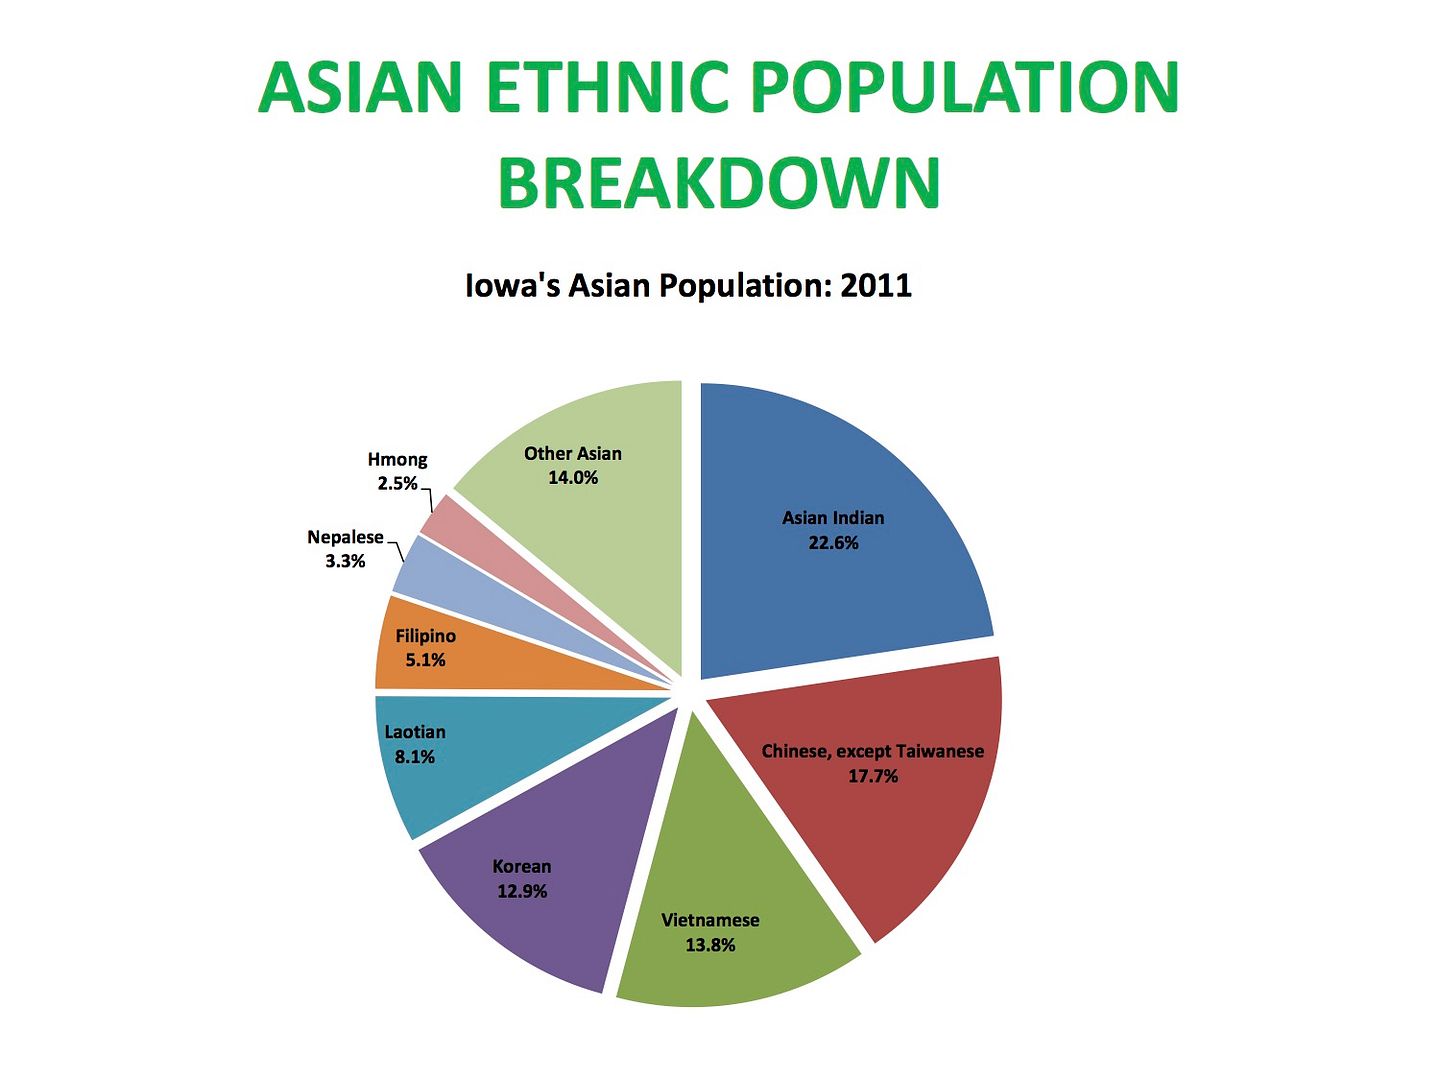
The latest census data suggest that as of July 2015, just under 75,000 Iowans (about 2.4 percent of the population) were Asian or Pacific Islanders. No one country dominates the ancestry of our state’s Asian-American community. This graphic comes from the report State of Asian Americans and Pacific Islanders in Iowa, 2015.
According to Sanjita Pradhan of the Office of Asian and Pacific Islanders in the Iowa Department of Human Rights, about 21,000 registered Iowa voters are Asian-Americans or Pacific Islanders.
Census data drawing on self-reported information estimated that 17,000 Asian-Americans cast ballots in Iowa’s 2012 general election, but that estimate seems impossibly high. Nationwide research has shown Asian-Americans turn out to vote at far lower rates than do their white or African-American counterparts, for various reasons including language barriers and less campaign outreach to the community.
Using voter registration files, the advocacy organization APIAVote determined that only about 5,560 Asian-Americans in Iowa voted in 2012, Pradhan told me.
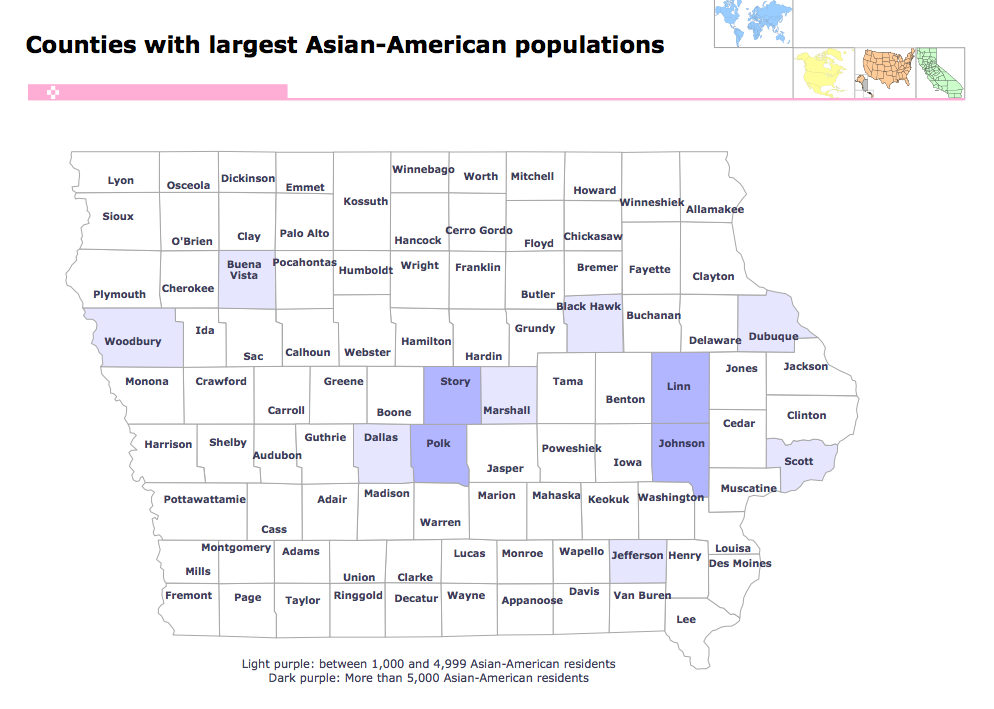
The Asian-American population is less dispersed around Iowa than are Latinos. Using the most recent available census data, I compiled a list of Iowa counties where at least 1,000 Asian-Americans live. Again, these numbers do not represent eligible or registered voters.
| Iowa counties with the most Asian-American residents | |||
| County | Estimated total population (July 2015) | Asian-American percentage | Estimated Asian-American population (July 2015) |
|---|---|---|---|
| Polk | 467,711 | 4.3 percent | 20,111 |
| Johnson | 144,251 | 6.4 percent | 9,232 |
| Story | 96,021 | 7.8 percent | 7,489 |
| Linn | 219,916 | 2.4 percent | 5,277 |
| Scott | 172,126 | 2.7 percent | 4,647 |
| Dallas | 80,133 | 4.0 percent | 3,205 |
| Woodbury | 102,782 | 2.8 percent | 2,877 |
| Black Hawk | 133,455 | 2.0 percent | 2,669 |
| Buena Vista | 20,493 | 8.3 percent | 1,701 |
| Jefferson | 17,555 | 11.6 percent | 1,457 |
| Dubuque | 97,125 | 1.4 percent | 1,359 |
| Marshall | 40,746 | 3.1 percent | 1,263 |
By my calculations, twelve Iowa counties have at least 1,000 Asian-American residents and would therefore be the likely focus of any voter mobilization effort.
Increasing voter registration is among the priorities of the state Office of Asian and Pacific Islanders.
The AAPI electorate is growing rapidly both nationally and in Iowa. Iowa’s Asian population experienced a 49.6% increase from 2000 to 2010 and more recently from 2000 to 2013 Iowa’s Asian population saw a 72.8% increase. Despite growing numbers of the Asian American electorate, significant gaps in citizenship and voter registration for Asian Americans continue to exist. AAPI’s have also been historically underrepresented in elected office and other government positions. To improve civic participation from Asian and Pacific Islander communities the office has the following goals:
· Voter Education—Ensuring all AAPI’s including newly naturalized people to learn about their new rights as a voter.
· Voter registration—Help more API’s to be registered to vote.
State-led voter engagement efforts will necessarily be non-partisan. That said, any increase in Asian-American turnout would likely benefit Clinton.
Considered a Republican-leaning voting bloc in the 1980s and 1990s, Asian-Americans been moving toward the Democratic Party for some time and favored Barack Obama over Mitt Romney by nearly a 3 to 1 margin. Scholars have explained the trend in various ways. Asian-Americans are more likely to line up with Democrats on issues like universal health care and raising taxes to reduce the federal deficit, as well as the concept of a bigger government providing more services, rather than a smaller government.
Writing at the Monkey Cage blog last year, Cecilia Hyunjung Mo noted,
My research with Alexander Kuo and Neil Malhotra offers one explanation. The feeling of social exclusion stemming from their ethnic background might be pushing Asian Americans away from the Republican Party.
Given Trump’s heavy use of “us and them” campaign rhetoric, who can be surprised by national polls showing Asian-Americans much prefer Clinton to the Republican nominee?
FINAL THOUGHTS
Campaigns facing challenges among “likely voters” have two paths to victory: win over enough of the non-supporters, or identify and activate enough “unlikely” voters who are already inclined to support your candidate.
Barack Obama’s strategists realized early in 2007 that their candidate trailed Clinton and John Edwards among Iowa Democrats who had caucused before. So they devised and implemented a brilliant strategy to expand the universe of 2008 Iowa caucus-goers.
Mobilizing minority voters will be only one aspect of a Democratic ground game involving hundreds of staff and volunteers in dozens of field offices around Iowa.
But as pollsters continue to measure support for Clinton and Trump among “likely Iowa voters,” most of whom are non-college-educated white people, keep in mind that a larger than average turnout among Latino, African-American, or Asian-American Iowans could help Clinton outperform her poll numbers.

