Early voting for Iowa’s June 7 primary begins on May 18. Democrats have one contested race for a federal office (Abby Finkenauer, Mike Franken, and Glenn Hurst are running for U.S. Senate) and one for a statewide office (Joel Miller and Eric Van Lancker are running for secretary of state). There are also many competitive primaries for Iowa House or Senate seats.
Turnout for this year’s primary will likely be much lower this year than in 2020, when Secretary of State Paul Pate sent every active registered voter an absentee ballot request form. In addition, a law Republicans enacted last year shortened Iowa’s early voting window from 29 days to 20 days and made it harder to return a completed ballot in time to have the vote counted.
Even so, more than 100,000 Democrats will likely participate in the June 7 election. I analyzed statistics and results from the last three cycles for clues on who Iowa Democratic primary voters are and where most of them live.
MORE THAN TWO-THIRDS OF PRIMARY VOTERS OVER AGE 50
I’ve said it before, and I will say it again: Iowa’s electorate is old.
As a general rule, the older the age cohort, the more registered voters fall into that age group. Older voters are also far more likely to participate in a primary election than are younger voters.
Using the statewide statistical reports published by the Iowa Secretary of State’s office, I created tables showing number of votes cast and turnout rates for Democrats in different age groups. Here are the numbers from the 2016 primary. Nearly 80 percent of voters were at least 50 years old.
| Turnout by age group, Iowa 2016 Democratic primary | ||||||
| Age | 18-24 | 25-34 | 35-49 | 50-64 | 65 and over | total |
|---|---|---|---|---|---|---|
| Registered | 57,575 | 107,862 | 137,138 | 183,012 | 182,009 | 667,596 |
| Total voted | 2,764 | 6,111 | 11,991 | 29,970 | 50,262 | 101,098 |
| Turnout rate | 4.8% | 5.7% | 8.7% | 16.4% | 27.6% | 15.1% |
| Percent of ballots cast | 2.7% | 6.0% | 11.9% | 29.6% | 49.7% | 100% |
Several candidates for governor spent heavily before the 2018 primary, and some of them targeted younger voters. So compared to 2016, there was a nearly threefold increase in the turnout rate among Democrats under age 35.
Even so, about 70 percent of those who cast a primary ballot were at least 50 years old.
| Turnout by age group, Iowa 2018 Democratic primary | ||||||
| Age | 18-24 | 25-34 | 35-49 | 50-64 | 65 and over | total |
|---|---|---|---|---|---|---|
| Registered | 55,555 | 103,244 | 136,612 | 175,427 | 194,494 | 665,332 |
| Total voted | 7,914 | 17,770 | 28,341 | 50,134 | 76,682 | 180,841 |
| Turnout rate | 14.3% | 17.2% | 20.8% | 28.6% | 39.4% | 27.2% |
| Percent of ballots cast | 4.4% | 9.8% | 15.7% | 27.7% | 42.4% | 100% |
Overall turnout was much higher in the 2020 primary, because as mentioned above, every registered voter received an absentee ballot request form from the Iowa Secretary of State’s office.
However, the age distribution changed little. The statewide statistical report shows that just under 71 percent of Democratic primary voters were at least 50 years old. (For the first time, official figures included 17-year-olds, who are eligible to vote in Iowa primaries if they will turn 18 by the general election date.)
| Turnout by age group, Iowa 2020 Democratic primary | ||||||
| Age | 17-24 | 25-34 | 35-49 | 50-64 | 65 and over | total |
|---|---|---|---|---|---|---|
| Registered | 70,256 | 114,746 | 149,704 | 178,035 | 218,139 | 730,880 |
| Total voted | 14,800 | 25,279 | 42,149 | 72,751 | 126,565 | 281,544 |
| Turnout rate | 21.1% | 22.0% | 28.2% | 40.9% | 58.0% | 38.5% |
| Percent of ballots cast | 5.3% | 9.0% | 15.0% | 25.8% | 45.0% | 100% |
I don’t have access to any of the Senate campaigns’ internal polling data, so it’s hard to say who benefits most from an older electorate. Franken is 64 years old, Hurst 52, and Finkenauer 33.
Franken’s first television commercial appeared to be aimed at an older demographic, highlighting his long military career and mentioning his work for U.S. Senator Ted Kennedy. Franken’s online advertising and social media posts have similarly tended to emphasize his qualifications or his experience, such as opposing the war in Iraq when U.S. military officials discussed the prospect in 2002.
MORE WOMEN THAN MEN
The statewide statistical reports break down the numbers by gender as well as by age and party affiliation. There is no category for nonbinary voters; they are listed as male or female.
More Iowa women are registered to vote than men. There’s a greater disparity among registered Democrats, reflecting the “gender gap” observed in U.S. voting behavior for about four decades.
In every recent Iowa Democratic primary, more women have voted than men. The share of women voters in the primary electorate was largest in 2020, when nearly three in five Democratic primary voters were women. It’s anyone’s guess whether that percentage will drop this year, with lower overall turnout.
Turnout by gender, Iowa Democratic primaries:
| 2016 | 2018 | 2020 | |
| women voted | 57,482 | 105,442 | 167,922 |
| Democratic ballots from women | 56.9% | 58.3% | 59.6% |
| men voted | 43,616 | 75,399 | 113,622 |
| Democratic ballots from men | 43.1% | 41.7% | 40.4% |
This factor favors Finkenauer in the Senate race. Women competing against one or more male candidates have won many Iowa Democratic primaries over the past decade.
Finkenauer also has endorsements from well-known women in politics including U.S. Representative Cindy Axne and more than a dozen state legislators.
Franken also has some endorsements from prominent women, including former Attorney General Bonnie Campbell, former Lieutenant Governor Patty Judge, and former State Senator Jean Lloyd-Jones (the Democratic nominee for U.S. Senate in 1992). Don’t be surprised if his campaign features more women in advertising as the primary election approaches.
CONCENTRATED IN URBAN/SUBURBAN COUNTIES
Using the official canvass by county, I created this table to show how many Democrats in the largest counties voted in the last three primaries.
I listed counties in descending order by number of ballots cast in the 2020 primary—not by total population. Johnson County (Iowa City area) has fewer residents than Scott County (Quad Cities), but far more Democratic primary voters.
Votes cast in recent Democratic primaries (large counties)
| County | 2016 (Senate) | 2018 (Governor) | 2020 (Senate) |
| Polk | 19,917 | 43,071 | 56,295 |
| Linn | 11,422 | 16,156 | 26,735 |
| Johnson | 8,189 | 17,155 | 24,652 |
| Scott | 4,218 | 7,783 | 14,772 |
| Dubuque | 6,299 | 9,040 | 12,231 |
| Black Hawk | 3,712 | 6,754 | 11,901 |
| Story | 2,998 | 7,335 | 9,753 |
| Dallas | 1,843 | 4,910 | 8,347 |
| Woodbury | 2,277 | 4,247 | 6,144 |
| Pottawattamie | 1,273 | 2,628 | 5,866 |
| large county total | 62,148 | 119,079 | 176,696 |
| statewide total | 101,991 | 182,736 | 282,794 |
| large county share of vote | 60.9% | 65.2% | 62.5% |
I expect the 2022 Democratic primary vote to be even more concentrated in the largest counties, because there are nearly a dozen hard-fought competitive primaries, mostly for open legislative seats:
- House district 30, House district 31, House district 36, House district 43, Senate district 17 (Polk County)
- Senate district 37, Senate district 39, county supervisor (Linn County)
- House district 89, House district 90, Senate district 45 (Johnson County)
Also worth noting: Finkenauer grew up in Dubuque and now lives in Cedar Rapids (Linn County). She represented those counties and Black Hawk for two years in Congress.
Franken grew up in rural northwest Iowa and moved to Sioux City (Woodbury County) after retiring from the Navy.
Hurst lives and works in Pottawattamie County.
I’ve taken an interest in mid-sized counties, where Iowa Democrats have most noticeably lost ground (and state legislative seats) in recent elections. The following table shows the sixteen counties where between 2,000 and 5,000 Iowans voted in the 2020 Democratic primary. I listed them in descending order by votes cast in that election.
Most of these are “micropolitan” counties containing cities with populations between 15,000 and 40,000. A few contain college towns. I’ve put the largest city’s name in parentheses for each county.
Votes cast in recent Democratic primaries (mid-sized counties)
| County | 2016 (Senate) | 2018 (Governor) | 2020 (Senate) |
| Warren (Indianola) | 1,488 | 3,415 | 4,891 |
| Clinton (Clinton) | 714 | 1,610 | 4,096 |
| Des Moines (Burlington) | 881 | 1,977 | 3,874 |
| Cerro Gordo (Mason City) | 886 | 1,612 | 3,600 |
| Jasper (Newton) | 2,601 | 2,335 | 3,232 |
| Muscatine (Muscatine) | 1,206 | 1,347 | 2,998 |
| Jackson (Maquoketa) | 868 | 1,089 | 2,943 |
| Lee (Keokuk) | 2,227 | 1,871 | 2,876 |
| Webster (Fort Dodge) | 1,038 | 1,645 | 2,814 |
| Marshall (Marshalltown) | 1,122 | 1,822 | 2,730 |
| Boone (Boone) | 664 | 1,597 | 2,513 |
| Winneshiek (Decorah) | 1,198 | 2,418 | 2,365 |
| Wapello (Ottumwa) | 1,832 | 1,192 | 2,356 |
| Marion (Pella/Knoxville) | 625 | 1,395 | 2,313 |
| Bremer (Waverly) | 962 | 1,238 | 2,055 |
| Jefferson (Fairfield) | 831 | 2,094 | 2,011 |
| mid-sized county total | 19,143 | 28,657 | 47,667 |
| statewide total | 101,991 | 182,736 | 282,794 |
| mid-sized county share of vote | 18.8% | 15.7% | 16.9% |
These numbers indicate that there is no path to an Iowa Democratic nomination by running up the score in rural counties. Around 80 percent of the votes are cast by residents of around a quarter of the counties.
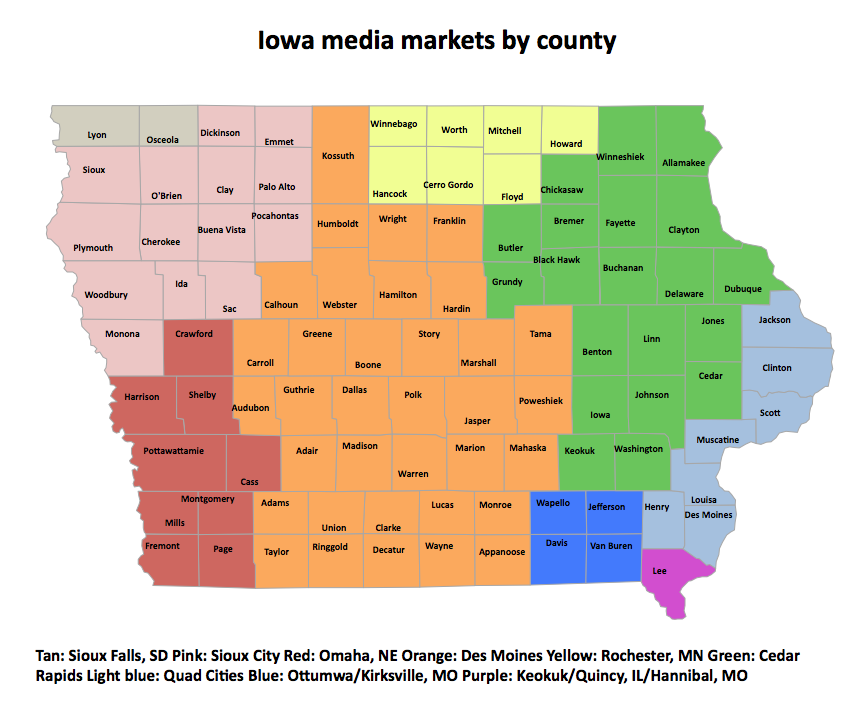
You can also see why Democratic campaigns that can afford television advertising usually focus on the Des Moines and Cedar Rapids markets. Des Moines-based stations reach voters in Polk, Story, Dallas, Warren, Jasper, Marshall, Webster, Boone, and Marion counties, in addition to many smaller counties. Cedar Rapids- or Waterloo-based stations reach those living in Linn, Johnson, Black Hawk, and Dubuque, as well as many smaller counties.
This map shows Iowa media markets (click here to enlarge).
I’ll follow up later this summer when official statistics on the 2022 Democratic primary voters become available.


