Thirteenth in a series interpreting the results of Iowa’s 2018 state and federal elections.
Immediately after the November election, it was obvious turnout in Iowa was unusually high for a non-presidential year. Now that the Secretary of State’s office has published the statewide statistical report, we can get a closer look at which demographic groups were most engaged. Let’s dive in:
MUCH HIGHER TURNOUT AMONG DEMOCRATS AND INDEPENDENTS
Iowans of all political persuasions turned out in large numbers for the November election, but the sharpest increase was among Democrats and no-party voters. Democratic turnout was approximately 20 percent higher last year than for the 2010 and 2014 midterms and surpassed the level seen in 2002, when Governor Tom Vilsack and Senator Tom Harkin won re-election by comfortable margins.
Iowans affiliated with no party cast far more ballots in November than in any non-presidential election for decades.
Antipathy to President Barack Obama and other factors fueled GOP landslides in 2010 and 2014. So it’s not surprising that Republican turnout was only slightly higher in 2018 than in the last two midterms. Had Iowa Republican enthusiasm been at the same level in November as four or eight years ago, Fred Hubbell would be the governor-elect. He finished only about 36,000 votes behind Governor Kim Reynolds.
All numbers in this table come from statewide statistical reports available on the Iowa Secretary of State’s website.
| Turnout by party in Iowa midterms | |||||
| Party registration | 2002 | 2006 | 2010 | 2014 | 2018 |
|---|---|---|---|---|---|
| Democrats registered | 537,425 | 619,248 | 699,963 | 661,878 | 677,668 |
| Democrats voting | 353,584 | 384,983 | 395,312 | 374,990 | 458,902 |
| Democratic turnout | 65.8% | 62.2% | 56.5% | 56.7% | 67.7% |
| GOP registered | 589,517 | 595,464 | 648,646 | 663,177 | 688,246 |
| GOP voting | 412,863 | 386,382 | 447,445 | 452,283 | 492,802 |
| GOP turnout | 70.0% | 64.9% | 69.0% | 68.2% | 71.6% |
| no-party registered | 685,329 | 766,752 | 773,282 | 807,088 | 803,429 |
| no-party voting | 254,753 | 273,094 | 281,546 | 305,108 | 368,772 |
| no-party turnout | 37.2% | 35.6% | 36.5% | 37.8% | 45.9% |
| total registered | 1,812,271 | 1,981,464 | 2,124,116 | 2,138,683 | 2,187,097 |
| total voting | 1,021,200 | 1,044,459 | 1,125,386 | 1,135,138 | 1,329,930 |
| total turnout | 56.3% | 52.7% | 53.0% | 53.1% | 60.8% |
DESPITE HIGHER YOUTH TURNOUT, MOST VOTERS OVER 50
Iowans of all ages participated in the 2018 election at higher rates than in other recent midterms. The sharpest increases were among the youngest eligible voters, which surely helped Cindy Axne and Abby Finkenauer defeat two Republican members of Congress. Greater involvement by voters under 35 was probably an important factor in keeping the governor’s race relatively close as well.
However, older Iowans still vastly outnumber the millennials in the electorate. Last year, voters age 50 or over cast nearly three-fifths of the general election ballots (59.6 percent). Those under 35 cast less than one-fifth of the ballots (18.9 percent). That’s a slight shift from 2014, when about 64 percent of Iowans who voted were at least 50 years old, and about one-sixth were under 35.
For the foreseeable future, successful statewide candidates in Iowa will need to appeal to an older demographic.
| Turnout by age group in Iowa midterms | |||||
| Age group | 2002 | 2006 | 2010 | 2014 | 2018 |
|---|---|---|---|---|---|
| 18-24 registered | 221,763 | 239,189 | 248,766 | 237,397 | 248,411 |
| 18-24 voting | 48,811 | 51,776 | 59,861 | 56,020 | 93,808 |
| 18-24 turnout | 22.0% | 21.7% | 24.1% | 23.6% | 37.8% |
| 25-34 registered | 282,451 | 334,664 | 388,149 | 389,222 | 387,283 |
| 25-34 voting | 98,724 | 101,015 | 199,510 | 118,679 | 158,049 |
| 25-34 turnout | 35.0% | 30.2% | 30.8% | 30.5% | 40.8% |
| 35-49 registered | 519,321 | 531,808 | 514,112 | 488,332 | 495,720 |
| 35-49 voting | 299,644 | 275,648 | 257,406 | 234,020 | 286,080 |
| 35-49 turnout | 57.7% | 51.8% | 50.1% | 47.9% | 57.7% |
| 50-64 registered | 409,211 | 485,029 | 550,169 | 564,865 | 545,745 |
| 50-64 voting | 296,631 | 334,672 | 378,349 | 379,881 | 391,837 |
| 50-64 turnout | 72.5% | 69.0% | 68.8% | 67.3% | 71.8% |
| Over 65 registered | 379,520 | 390,771 | 422,920 | 458,866 | 509,937 |
| Over 65 voting | 277,390 | 281,346 | 310,259 | 346,538 | 400,156 |
| Over 65 turnout | 73.1% | 72.0% | 73.4% | 75.5% | 78.5% |
| total registered | 1,812,271 | 1,981,464 | 2,124,116 | 2,138,683 | 2,187,097 |
| total voting | 1,021,200 | 1,044,459 | 1,125,386 | 1,135,138 | 1,329,930 |
| total turnout | 56.3% | 52.7% | 53.0% | 53.1% | 60.8% |
NO SIGNS OF A GENDER GAP IN TURNOUT
Iowans elected a woman governor, two women to the U.S. House, and record numbers of women to the state legislature in 2018, so I was eager to see the gender breakdown of last year’s midterm participants.
The new numbers don’t suggest that Iowa women were significantly more engaged in the latest election than men. Turnout increased by roughly the same amount for both groups. (Note: the Iowa Secretary of State’s office does not record data about non-binary or gender-nonconforming voters.)
Opinion polls from around the country suggests that women, especially suburban women, were more inclined to support Democratic candidates in 2018 than in past midterms. It appears that Axne and the five Democrats who won Republican-held Iowa House seats in the Des Moines suburbs benefited from a growing gender gap in political preferences, not from disparate levels of interest in voting among men and women.
| Turnout by gender in Iowa midterms | |||||
| Gender | 2002 | 2006 | 2010 | 2014 | 2018 |
|---|---|---|---|---|---|
| Women registered | 962,028 | 1,049,370 | 1,116,622 | 1,119,837 | 1,140,506 |
| Women voting | 541,145 | 552,260 | 587,561 | 593,649 | 697,349 |
| Female turnout | 56.3% | 52.6% | 52.6% | 53.0% | 61.1% |
| Men registered | 850,172 | 932,050 | 1,007,485 | 1,018,827 | 1,046,586 |
| Men voting | 480,036 | 492,198 | 537,824 | 541,489 | 632,581 |
| Male turnout | 56.5% | 52.8% | 53.4% | 53.2% | 60.4% |
| total registered | 1,812,271 | 1,981,464 | 2,124,116 | 2,138,683 | 2,187,097 |
| total voting | 1,021,200 | 1,044,459 | 1,125,386 | 1,135,138 | 1,329,930 |
| total turnout | 56.3% | 52.7% | 53.0% | 53.1% | 60.8% |
Any comments about turnout in 2018 are welcome in this thread.
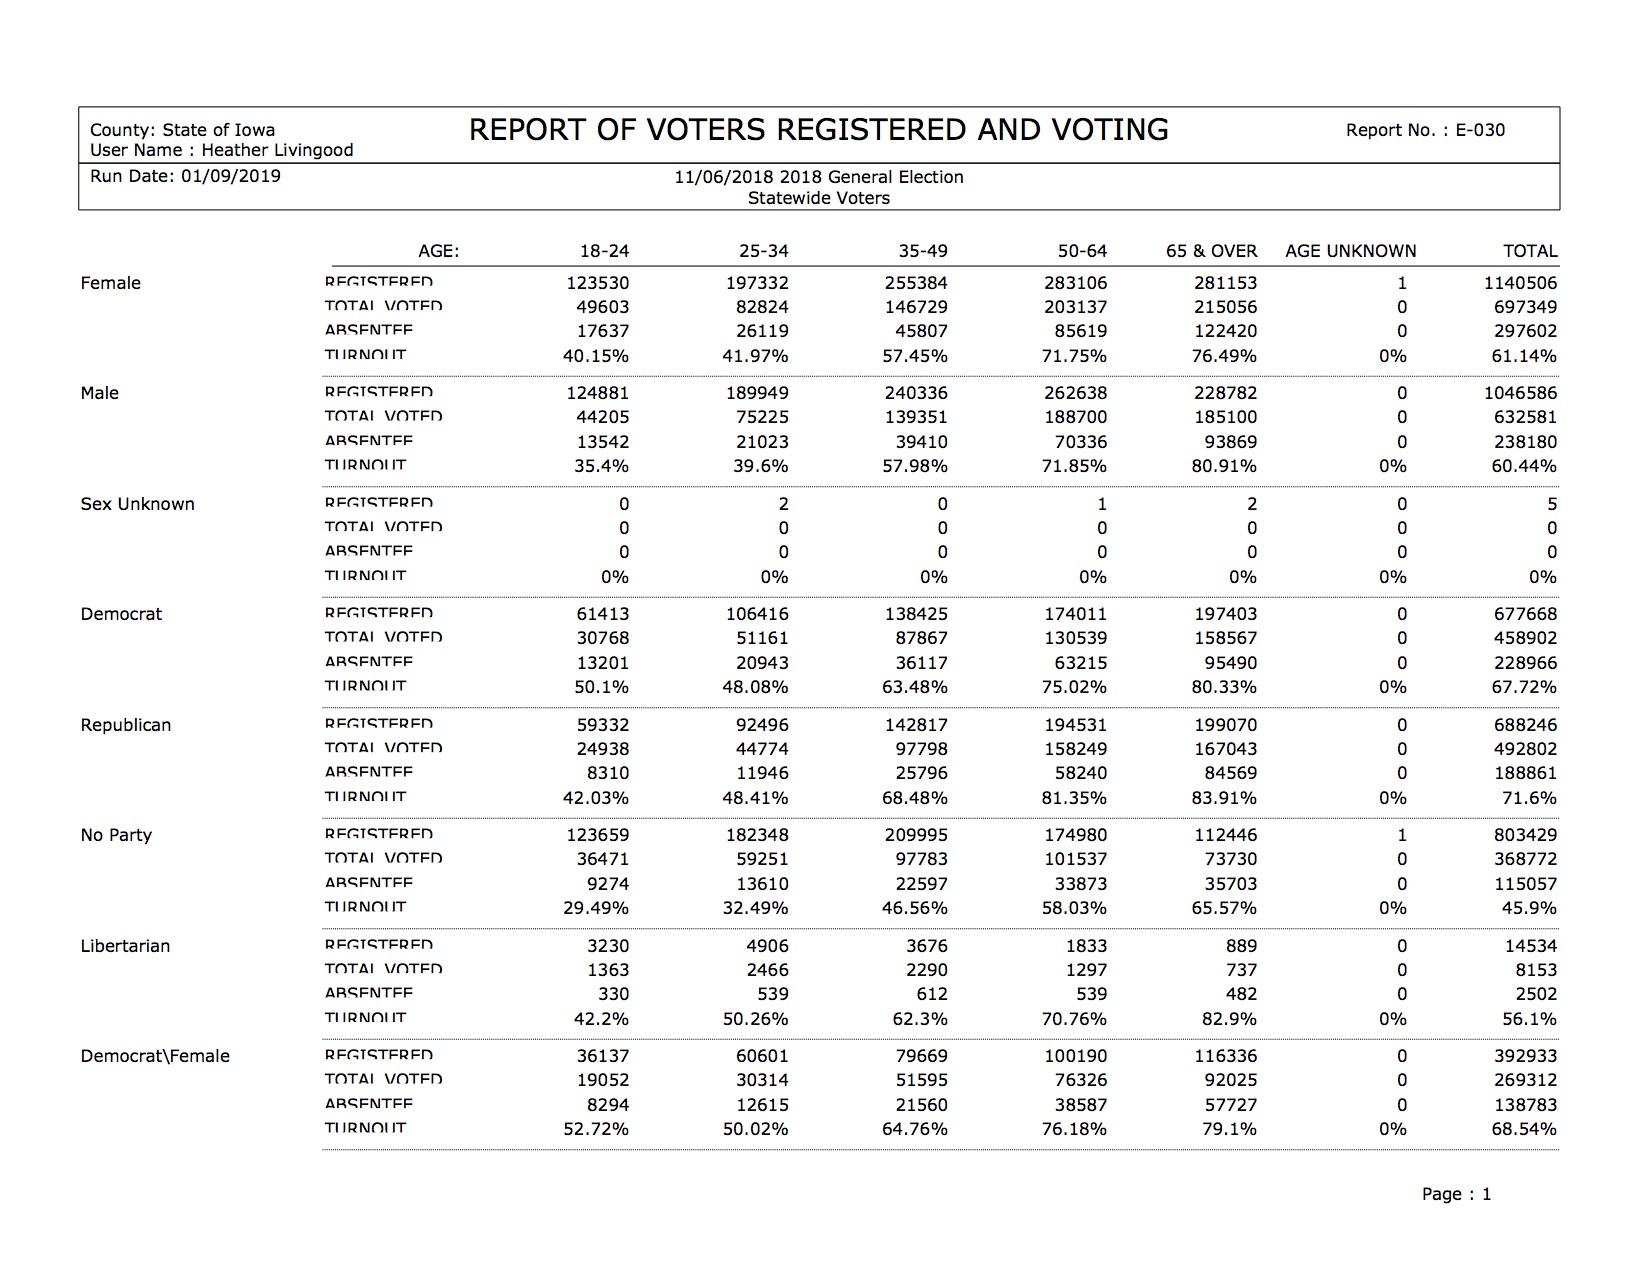
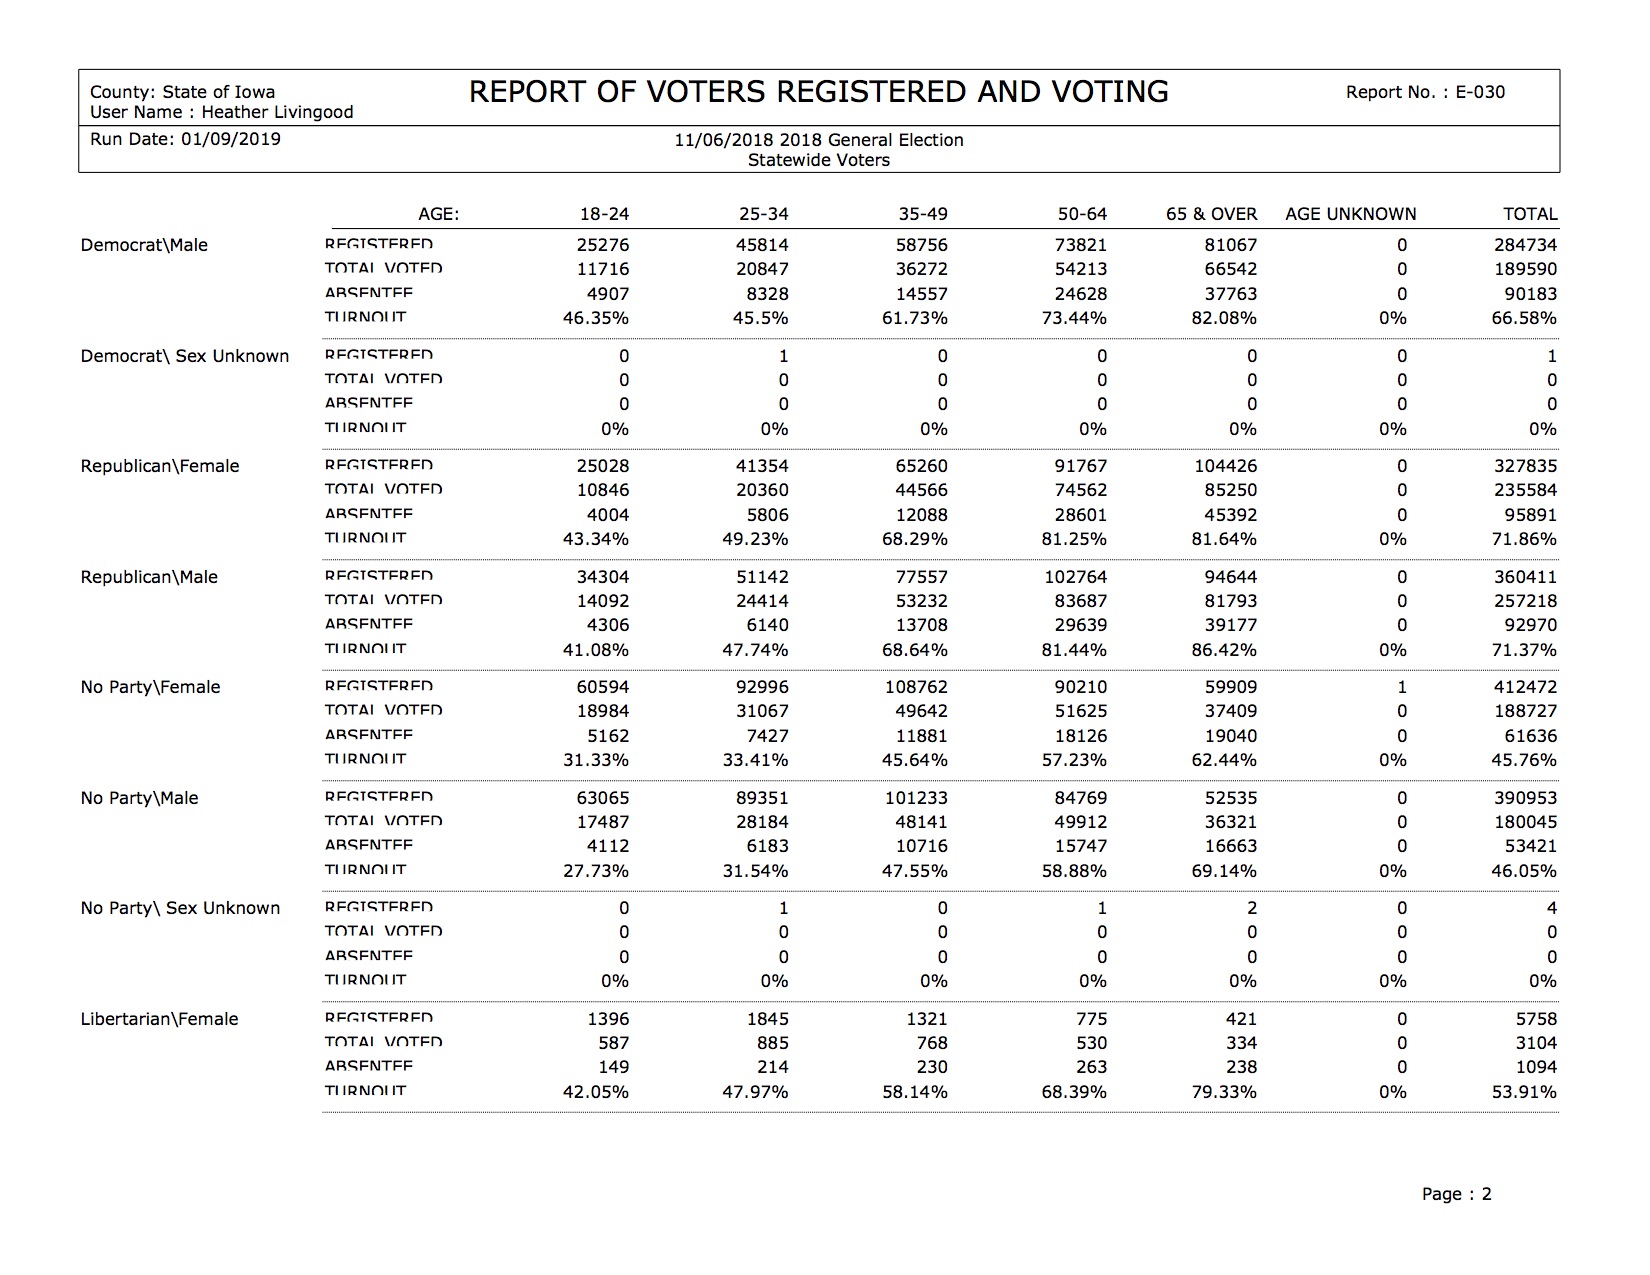
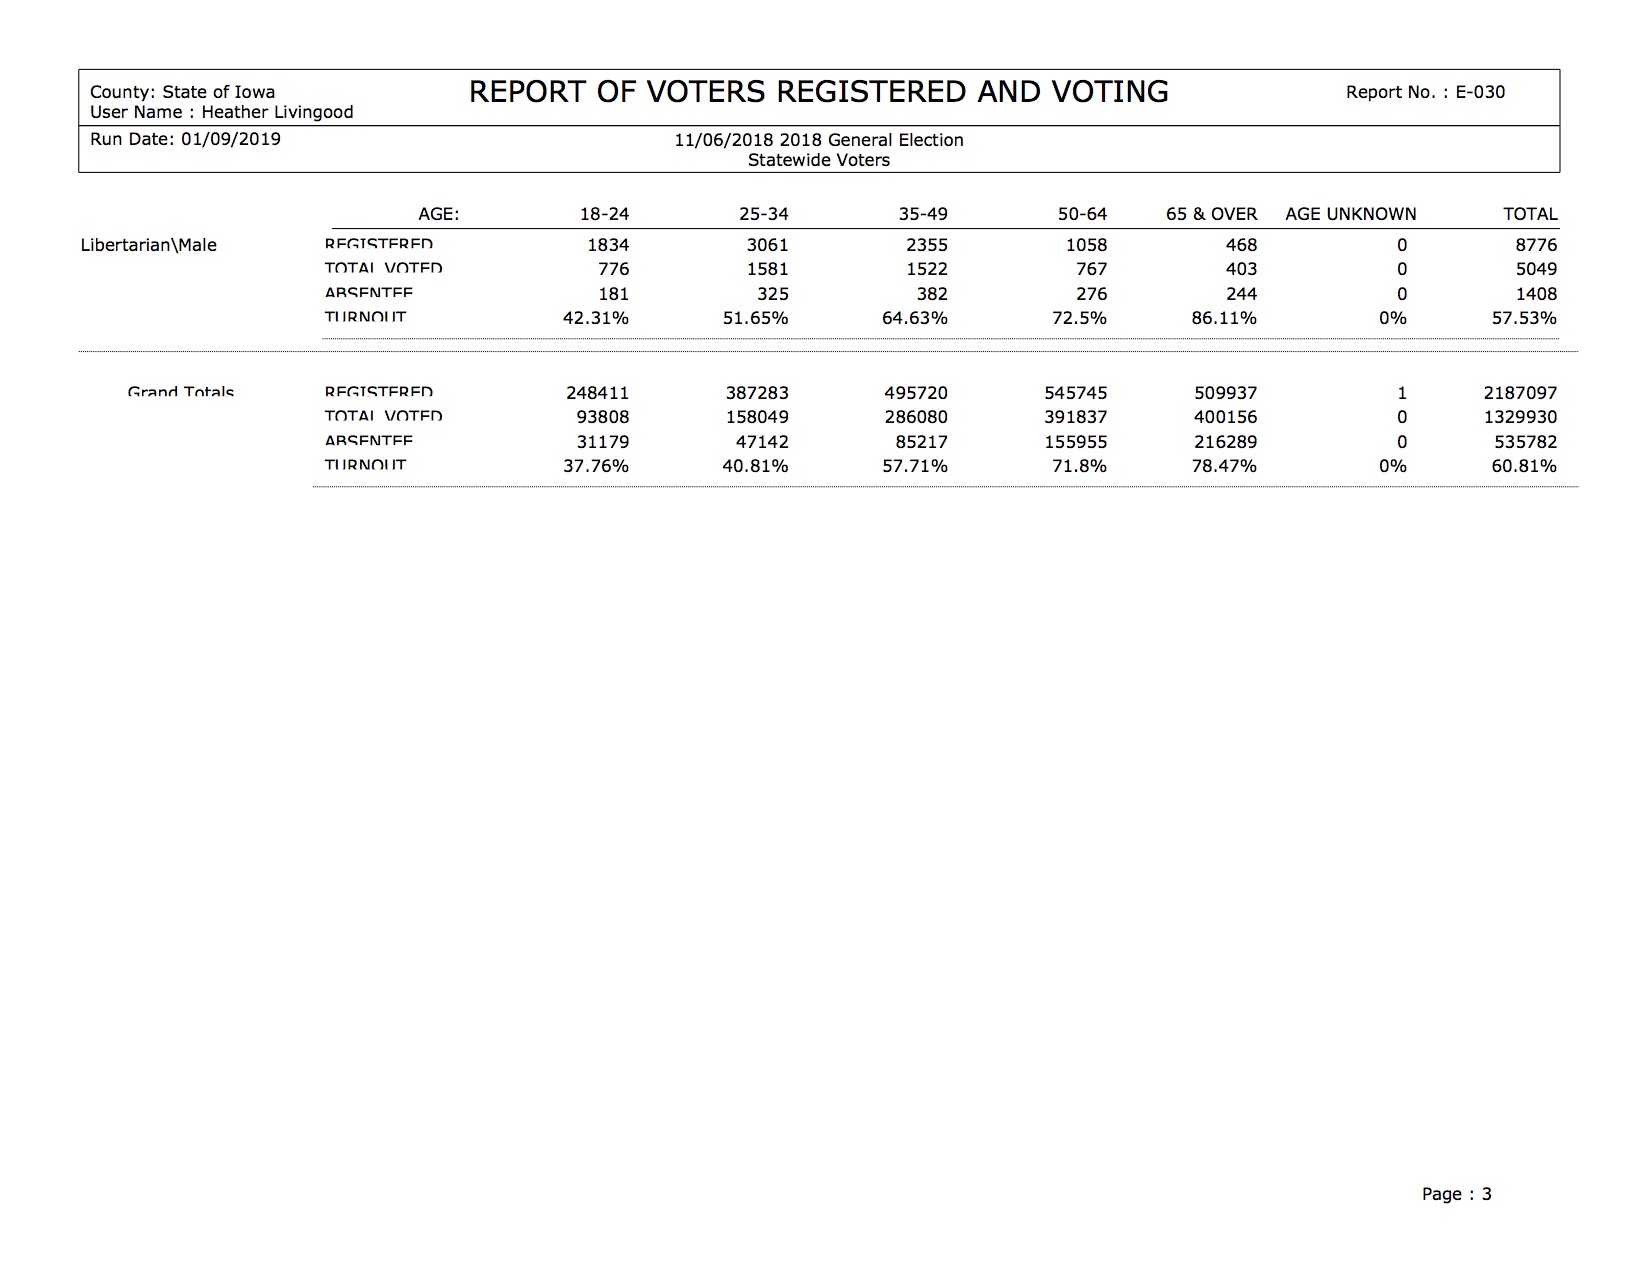
Appendix: All three pages of the statewide statistical report on Iowa’s 2018 general election


