First in a series interpreting the results of Iowa’s 2018 state and federal elections. Since publication, I have updated numbers with official totals.
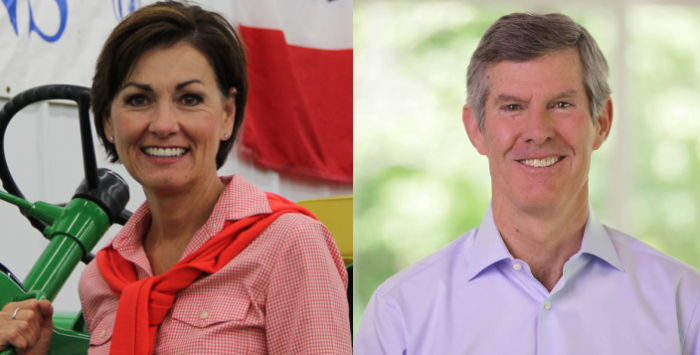
Fred Hubbell received more votes than any Democratic nominee for Iowa governor since Harold Hughes was re-elected in the 1964 Democratic landslide. He gained more votes than most of the candidates elected Iowa governor in the past 50 years, including Terry Branstad five of the six times he was on the ballot. Nevertheless, Hubbell lost to Governor Kim Reynolds by about 39,000 votes, according to unofficial returns (UPDATE: The final margin was about 36,000 votes.)
Anecdotal reports of long lines at Iowa polling places on November 6 cheered Hubbell supporters, but the outcome of the governor’s race is a reminder that high turnout doesn’t only help Democrats.
Until the statewide statistical report on Iowa’s 2018 general election comes out in January, we won’t have official numbers showing how many Democrats, Republicans, and no-party voters participated. But we do know:
Bleeding Heartland will publish a more detailed county-level analysis of the gubernatorial vote in the coming days. For now, note that turnout increased substantially in the best-performing counties for Democrats. Population growth could account for some of the higher participation, but many precincts that aren’t growing also had more voters cast ballots this year.
Traditionally, Democrats have believed that netting 30,000 votes in Polk puts a nominee on track to win statewide. Unfortunately for Hubbell, turnout was also high in strong Republican counties. Picking a few in the northwest corner:
Keep in mind that Iowa Republicans are more reliable voters than their Democratic counterparts, even in good years for Democrats like 2002 (when Senator Tom Harkin and Governor Tom Vilsack were comfortably re-elected) and 2006 (when Chet Culver won the governor’s race and Democrats gained control of both legislative chambers).
| Turnout by party in Iowa midterms | ||||
| Party registration | 2002 | 2006 | 2010 | 2014 |
|---|---|---|---|---|
| Democrats registered | 537,425 | 619,248 | 699,963 | 661,878 |
| Democrats voting | 353,584 | 384,983 | 395,312 | 374,990 |
| Democratic turnout | 65.8% | 62.2% | 56.5% | 56.7% |
| GOP registered | 589,517 | 595,464 | 648,646 | 663,177 |
| GOP voting | 412,863 | 386,382 | 447,445 | 452,283 |
| GOP turnout | 70.0% | 64.9% | 69.0% | 68.2% |
| no-party registered | 685,329 | 766,752 | 773,282 | 807,088 |
| no-party voting | 254,753 | 273,094 | 281,546 | 305,108 |
| no-party turnout | 37.2% | 35.6% | 36.5% | 37.8% |
| total registered | 1,812,271 | 1,981,464 | 2,124,116 | 2,138,683 |
| total voting | 1,021,200 | 1,044,459 | 1,125,386 | 1,135,138 |
| total turnout | 56.3% | 52.7% | 53.0% | 53.1% |
Democrats needed substantially higher participation compared to 2010 and 2014 just to be in the game. But higher Democratic turnout was a necessary condition, not a sufficient one. Reynolds was able to gain the votes she needed to overcome Hubbell’s numbers.
Last night I recalled how John Kerry’s 2004 presidential campaign set a vote goal of 700,000 for Iowa, assuming that would be enough, since Al Gore had carried Iowa in 2000 with 638,517 votes. Kerry exceeded his campaign’s targets in many counties, gaining 741,898 votes statewide. Unfortunately, surging Iowa Republican turnout pushed President George W. Bush about 10,000 votes ahead.
On Iowa Democratic social media feeds, some disappointed progressives are already blaming Hubbell for “blowing it” or having “no grassroots” support. They say this loss proves Democrats need to nominate candidates who can inspire the base.
Reality check: Hubbell outpolled most people who have been elected governor of Iowa. Even though many highly engaged Democratic activists preferred other candidates in the primary, Hubbell generated strong base turnout in November. Turnout on large college campuses exceeded previous records for Iowa midterm elections. Before last night, if you’d told Iowa politics watchers Hubbell would win more than 620,000 votes, most would have said that would be enough to beat Reynolds.
Forthcoming posts will further examine the returns in the governor’s race.

