A Geographic Analysis of PA, OH and VA General Election Polling
(Cross-posted on MyDD and Daily Kos)
A number of state polls have come out in recent days for Pennsylvania, Ohio, and Virginia. The numbers overall look good for Barack Obama, with him leading John McCain in Pennsylvania in all four polls released in May; Obama leading outside the margin of error in one poll in Ohio while being within the margin in two others; and a very competitive race in Virginia as well, with one poll there showing Obama up by seven points (links to polls used are provided at bottom of this diary). What I wanted to do in this diary is to look at the regional breakdown in Pennsylvania, Ohio, and Virginia to examine Obama’s geographic areas of strength and weakness.
Rasmussen was the only pollster who did not provide a regional breakdown. The other pollsters did provide decent regional data for each state. One problem was that the sample sizes are obviously relatively small. Another problem was trying to match up the regions from different polls. Only the sample size for each geographic area was normally provided (although some polls actually listed the particular counties in each region), and those varied a bit between each pollster – so there was a lot of educated geographical analysis going on here in trying to best approximate the boundaries of each region, and therefore a lot of this should be examined in that context. Nevertheless, as we have at least two separate polls to work with for each state (three for Pennsylvania) we can average and map the results and see if any patterns emerge.
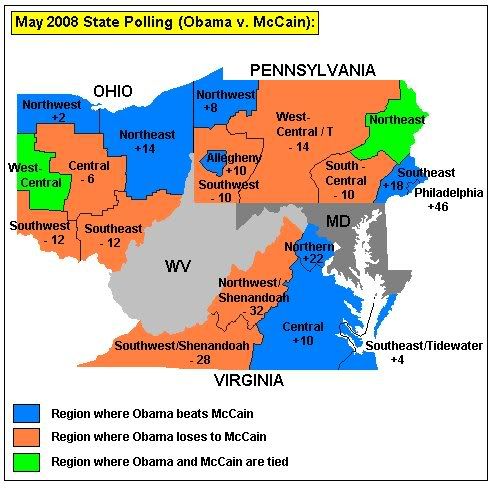
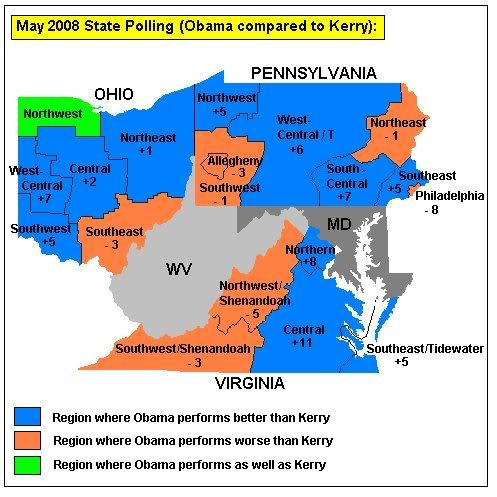
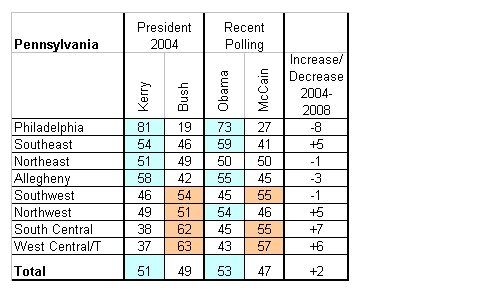
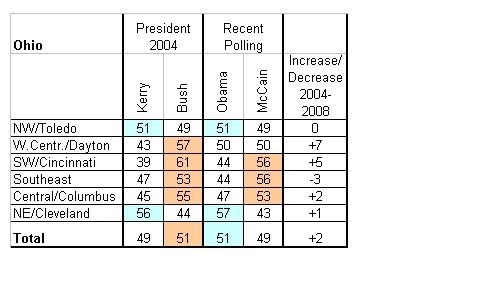
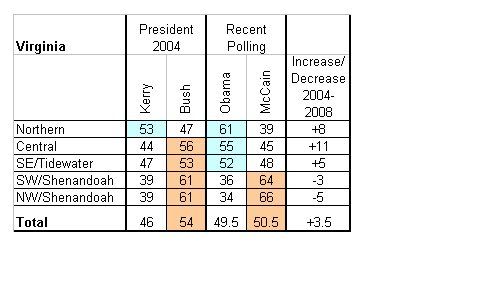
Two maps are provided below. The first shows how Obama and McCain match up against each other based on the most recent polls. The second map shows how Obama performs relative to John Kerry in 2004. For both the 2004 results, as well as the 2008 projections, I rounded out the numbers to account for “other” as well as “undecided”; in this way, it’s much easier to compare the data. So, for example, in the SUSA poll of Pennsylvania, McCain leads Obama 46-38 in Northeastern PA; in the Quinnipiac poll, McCain loses to Obama by 37 to 48 in the Northeast; and in the Susquehanna poll, McCain leads 43 to 40 in that region. The three sets of numbers are then averaged out, yielding McCain 42 – Obama 42. Those numbers are then rounded up to where the total equals 100% (in this case a perfect 50/50 tie). You can then compare to how Obama does compared to Kerry. Kerry won Northeast PA 51-49 in 2004, so Obama is performing one point worse than Kerry in that region (note: for this analysis, I’m using the percentage comparison between Kerry’s number and Obama’s, ie. the difference between 51 and 50 is one point; and not the difference in the margin between the two sets of numbers which in this case would yield two points as 51-49 is a two point difference compared to a zero point difference in 50/50 split; I hope this makes sense). Also provided are spreadsheet tables for each state where you can see the raw data.
In some way Obama seems to “change the map” not only when looking at a map of states in the national picture, but may also be changing the map WITHIN particular states.
In Pennsylvania, Obama easily carries Philadelphia and its suburbs, Pittsburgh/Allegheny Co. as well as the Northwest corner of the state. He is tied with McCain in the Northeastern part of the state which includes cities like Scranton and Wilkes-Barre. Obama performs a bit worse than Kerry in the Southwestern corner of the state (the most “Appalachian” part of the state), but he makes up for it by outperforming Kerry in the Southeast (Philadelphia suburbs) and perhaps surprisingly in the Central reaches of the state. One anomaly seems to be the city of Philadelphia. Two pollsters specifically provided data for just the city, and both reach the result that Obama is under-performing there compared to Kerry. Both pollsters – Quinnipiac and Susquehanna – show that Obama is winning 93-94% of the African-American vote (compared to 3-4% for McCain) so that factor does not appear to be a problem. My only guess is that Obama may be currently under-performing in the mostly white northeastern part of the city (?).
In Ohio, Obama cleans McCain’s clock across the northern swath of the state. He performs as well as or better than Kerry in every single region of the state, except for the Southeast (the most “Appalachian” part of Ohio). Obama’s strength, relative to Kerry, is especially evident in the normally more Republican western regions of the state. It is interesting to note that Obama’s weakness in Southeast Ohio could be remedied if Governor Ted Strickland became part of the ticket. Strickland hails from Southeast Ohio, and in his successful 2006 run, carried over 70% of the vote in that part of Ohio.
In Virginia, Obama runs exceptionally well not just in Northern Virginia, but across the Central and Southeastern parts of the state. Kerry lost Central Virginia as well as the Southeast (Tidewater/Hampton Roads area) in 2004 by solid margins, while Obama is beating McCain there by solid margins today. McCain’s Navy ties don’t seem to be providing him with an edge in the Southeast. Just like in Pennsylvania and in Ohio, the most “Appalachian” parts of Virginia are where Obama under-performs. (Based on this map, btw, I would not expect Obama to get more than 40% of the vote in the GE in West Virginia – this is based on how the parts of Pennsylvania, Ohio and Virginia which are adjacent to West Virginia are currently performing; things may, ofcourse, change by November.) Obama’s weakness in Virginia’s Shenandoah Valley could perhaps be remedied if Senator Jim Webb became part of the ticket; I believe he has ties to that part of the state.
Overall, Obama seems to be currently running approximately 2 points ahead of the 2004 numbers in both Pennsylvania and Ohio (resulting in Ohio flipping to our side). In Virginia, he seems to be running about 3 or 4 points ahead of Kerry, which is literally just on the cusp of flipping that state. Hopefully, the numbers in all three states will drift even more towards the blue side in the coming five months as the campaign unfolds.
Polls used:
Pennsylvania –
http://www.surveyusa.com/client/PollReport.aspx?g=162d4baa-59af-4ec5-9d9b-eb6e658e86c5
http://www.quinnipiac.edu/x2882.xml?ReleaseID=1180
http://www.susquehannapolling.com/polls/Presidential_May08.pdf
Ohio –
http://www.surveyusa.com/client/PollReport.aspx?g=b03c08ab-30b9-463d-8be2-5cb118e05b74
http://www.quinnipiac.edu/x2882.xml?ReleaseID=1180
Virginia –
http://www.surveyusa.com/client/PollReport.aspx?g=9901f8fc-034e-4a1d-ab36-f6e5c918614e
http://www.commonwealthpoll.vcu.edu/CPOLL%20Pres%20Race%20report%205-20-08.pdf

1 Comment
thanks for posting this here
I always enjoy reading your analysis.
Obama’s apparent weakness in OH, PA, MI and FL is my biggest concern.
I am hoping that turnout in the Appalachian parts of PA, OH and other states will be lower than it was in 2004, because McCain is not as much of a hero to Republicans as Bush was in 2004.
As you probably know, there was a considerable GOP primary vote for Huckabee in OH and PA, even though McCain had locked up the nomination. Do you have any data about where the Republican Huckabee voters were located within those states?
My hope is that some of them will stay home in November.
I am skeptical that VA with its huge military and veteran population would not go for a Republican war hero, but I know that the demographics of that state have changed considerably.
desmoinesdem Sun 25 May 1:18 AM