The U.S. Census Bureau released a ton of new Iowa demographic information yesterday.
Data for Iowa show that the five most populous incorporated places and their 2010 Census counts are Des Moines, 203,433; Cedar Rapids, 126,326; Davenport, 99,685; Sioux City, 82,684; and Waterloo, 68,406. Des Moines grew by 2.4 percent since the 2000 Census. Cedar Rapids grew by 4.6 percent, Davenport grew by 1.3 percent, Sioux City decreased by 2.7 percent and Waterloo decreased by 0.5 percent.
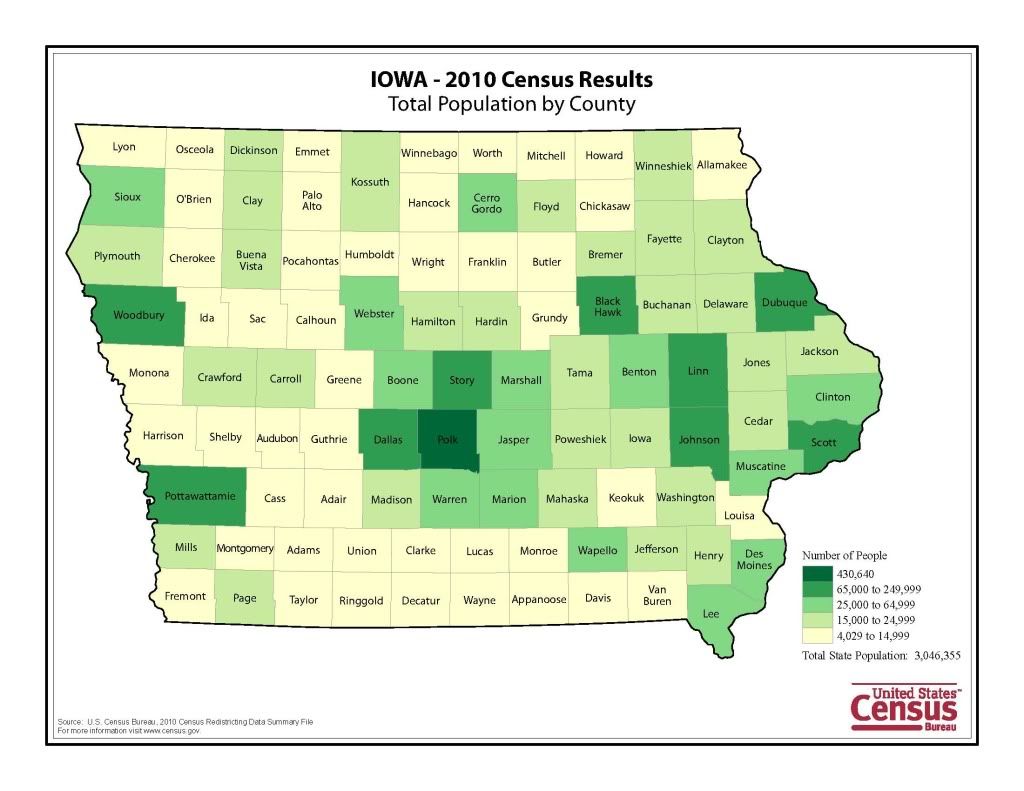
The largest county is Polk with a population of 430,640. Its population grew by 15.0 percent since 2000. The other counties in the top five include Linn, with a population of 211,226 (increase of 10.2 percent); Scott, 165,224 (increase of 4.1 percent); Black Hawk, 131,090 (increase of 2.4 percent); and Johnson, 130,882 (increase of 17.9 percent).
Click here to find the Iowa numbers and charts. I haven’t had as much time as I’d like to look through the data, but I’m posting a few starting points for discussion here.
Rick Smith’s piece on growth in the Cedar Rapids-Iowa City corridor is worth a read. I’m not surprised Linn County grew substantially during the decade, especially in the suburbs, but the population growth in Cedar Rapids itself is impressive. I didn’t expect to see that after the 2008 floods destroyed whole neighborhoods in the city.
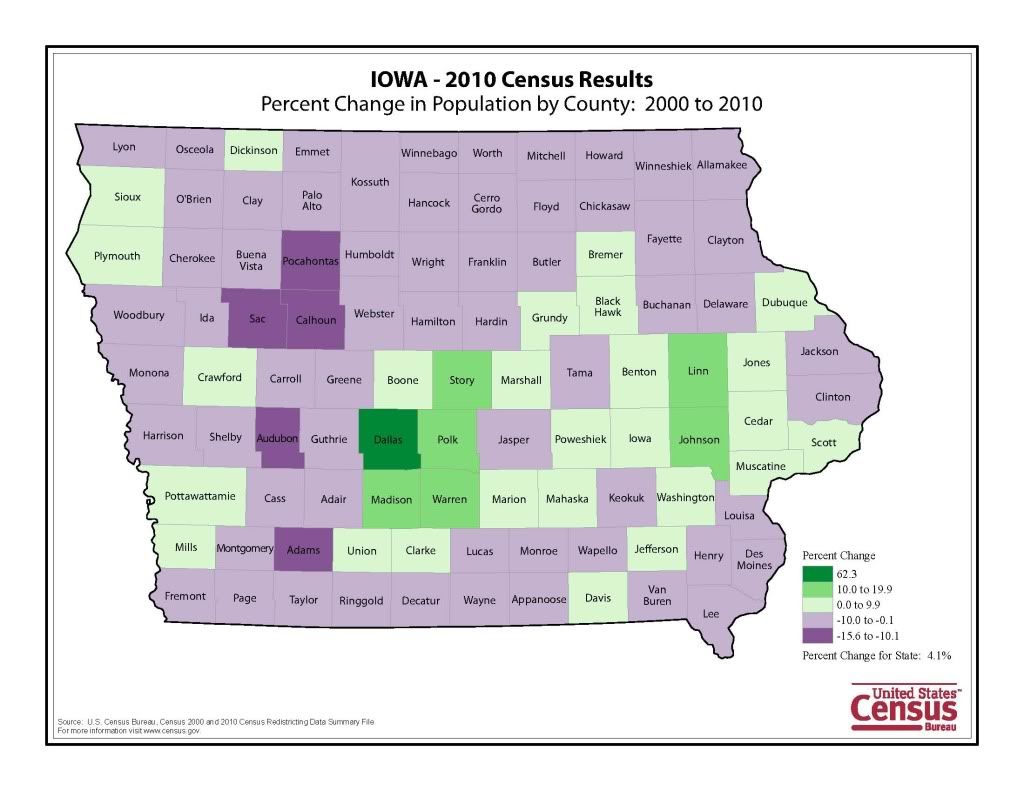
After the jump I’ve posted official 2010 population numbers for all 99 Iowa counties, along with a map putting the counties in different population categories and a map grouping counties by population gain or loss (percentage). Ten Iowa counties have populations larger than 65,000 people. Another 14 counties have populations between 25,000 and 64,999; 29 counties have populations between 15,000 and 24,999; and 46 counties have populations between 4,029 (Adams) and 14,999. Dallas led the 33 Iowa counties that gained population between 2000 and 2010.
Although I wasn’t able to reproduce this chart showing the racial and ethnic breakdown of the Iowa population by Congressional district, I did include those numbers at the end of this post. I was surprised to see that even though Polk County has the largest Latino/Hispanic population in Iowa, there are more Latino/Hispanic residents in IA-05 than in IA-03, with IA-02 and IA-04 not far behind. Meanwhile, IA-01 has the smallest Latino/Hispanic population but the largest African-American population. The largest Asian population is in IA-03 with IA-02 not far behind. View the chart here or scroll down for more details.
Share any thoughts about the census data or details that caught your eye in this thread. For example, the Newton Independent posted 2000 and 2010 numbers for Jasper County and area cities.
UPDATE: The Des Moines Register has lots of census coverage here. Statewide, Iowa’s population grew by 4.1 percent from 2000 to 2010. The Latino population was up by 83.8 percent, the Asian population was up by 44.9 percent, and the African-American population was up by 44.1 percent.
2010 U.S. Census data for Iowa population by county:
Total 3,046,355
Adair County 7,682
Adams County 4,029
Allamakee County 14,330
Appanoose County 12,887
Audubon County 6,119
Benton County 26,076
Black Hawk County 131,090
Boone County 26,306
Bremer County 24,276
Buchanan County 20,958
Buena Vista County 20,260
Butler County 14,867
Calhoun County 9,670
Carroll County 20,816
Cass County 13,956
Cedar County 18,499
Cerro Gordo County 44,151
Cherokee County 12,072
Chickasaw County 12,439
Clarke County 9,286
Clay County 16,667
Clayton County 18,129
Clinton County 49,116
Crawford County 17,096
Dallas County 66,135
Davis County 8,753
Decatur County 8,457
Delaware County 17,764
Des Moines County 40,325
Dickinson County 16,667
Dubuque County 93,653
Emmet County 10,302
Fayette County 20,880
Floyd County 16,303
Franklin County 10,680
Fremont County 7,441
Greene County 9,336
Grundy County 12,453
Guthrie County 10,954
Hamilton County 15,673
Hancock County 11,341
Hardin County 17,534
Harrison County 14,928
Henry County 20,145
Howard County 9,566
Humboldt County 9,815
Ida County 7,089
Iowa County 16,355
Jackson County 19,848
Jasper County 36,842
Jefferson County 16,843
Johnson County 130,882
Jones County 20,638
Keokuk County 10,511
Kossuth County 15,543
Lee County 35,862
Linn County 211,226
Louisa County 11,387
Lucas County 8,898
Lyon County 11,581
Madison County 15,679
Mahaska County 22,381
Marion County 33,309
Marshall County 40,648
Mills County 15,059
Mitchell County 10,776
Monona County 9,243
Monroe County 7,970
Montgomery County 10,740
Muscatine County 42,745
O’Brien County 14,398
Osceola County 6,462
Page County 15,932
Palo Alto County 9,421
Plymouth County 24,986
Pocahontas County 7,310
Polk County 430,640
Pottawattamie County 93,158
Poweshiek County 18,914
Ringgold County 5,131
Sac County 10,350
Scott County 165,224
Shelby County 12,167
Sioux County 33,704
Story County 89,542
Tama County 17,767
Taylor County 6,317
Union County 12,534
Van Buren County 7,570
Wapello County 35,625
Warren County 46,225
Washington County 21,704
Wayne County 6,403
Webster County 38,013
Winnebago County 10,866
Winneshiek County 21,056
Woodbury County 102,172
Worth County 7,598
Wright County 13,229
Percent Change in Iowa Population by County:
Summary file on Race and Hispanic or Latino by Congressional District
Iowa statewide
total population: 3,046,355
identified by race: 2,993,022
white: 2,781,561
black or African-American 89,148
American Indian and Alaska native: 11,084
Asian: 53,094
Native Hawaiian or Pacific Islander: 2,003
Some other race: 56,132
two or more races: 53,333
Hispanic or Latino (of any race): 151,544
IA-01
total population: 596,443
identified by race: 585,084
white: 542,199
black or African-American 28,205
American Indian and Alaska native: 1,309
Asian: 6,831
Native Hawaiian or Pacific Islander: 699
Some other race: 5,841
two or more races: 11,359
Hispanic or Latino (of any race): 19,084
IA-02
total population: 620,856
identified by race: 608,386
white: 562,459
black or African-American 19,927
American Indian and Alaska native: 1,611
Asian: 13,965
Native Hawaiian or Pacific Islander: 375
Some other race: 10,049
two or more races: 12,470
Hispanic or Latino (of any race): 28,721
IA-03
total population: 642,116
identified by race: 629,417
white: 568,207
black or African-American 27,358
American Indian and Alaska native: 3,101
Asian: 16,536
Native Hawaiian or Pacific Islander: 311
Some other race: 13,904
two or more races: 12,699
Hispanic or Latino (of any race): 36,903
IA-04
total population: 609,487
identified by race: 601,472
white: 573,138
black or African-American 7,638
American Indian and Alaska native: 1,347
Asian: 10,000
Native Hawaiian or Pacific Islander: 216
Some other race: 9,133
two or more races: 8,015
Hispanic or Latino (of any race): 27,250
IA-05
total population: 577,453
identified by race: 568,663
white: 535,558
black or African-American 6,020
American Indian and Alaska native: 3,716
Asian: 5,762
Native Hawaiian or Pacific Islander: 402
Some other race: 17,205
two or more races: 8,790
Hispanic or Latino (of any race): 39,586


8 Comments
I'm curous to see
how our maps turned out…the ones from here:
http://www.bleedingheartland.c…
ghbraves Fri 11 Feb 8:54 AM
Krusty's numbers
From Krusty’s “K” map last year:
1. 756,132
2. 760,958
3. 768,142
4. 761,123
xjcsa Fri 11 Feb 5:25 PM
in other words
he is out of the tolerance zone too.
desmoinesdem Fri 11 Feb 9:23 PM
I actually went ahead and checked my estimates
They’re a bit off on both of my maps.
My original map had
763,761 – Red
759,188 – Orange/Yellow
751,739 – Green
771,667 – Blue/Purple
Had I moved Keokuk county from Blue to Green, It would have been:
763,761 – Red
759,188 – Orange/Yellow
762,250 – Green
761,156 – Blue/Purple
Alas.
From the comments, my second map (I worked less hard on it) had
773,108 – Red
745,115 – Orange/Yellow
734,427 – Green
793,705 – Blue/Purple
Frankly, it’s kind of fun.
ghbraves Fri 11 Feb 1:48 PM
you did well
eyeballing it more than a year before the actual census. Your projection for Dallas County must have been pretty close to the actual number.
desmoinesdem Fri 11 Feb 2:20 PM
Thanks
I’ll have to find that scribbled map that I made with my estimates to see how close I was for Dallas.
ghbraves Fri 11 Feb 3:13 PM
Work's all done then, right?
If you move Keokuk, your biggest district is less than 101% of your smallest district! You should repost your amended map and declare victory! Redistricting all done!
iowavoter Fri 11 Feb 2:48 PM